

IDEs, webpack, Syncthing and tail -f all die with ENOSPC when a user runs out of inotify watches — and nothing tells you who is hogging them. This Ruby script reads /proc and shows the budget per user and per process.
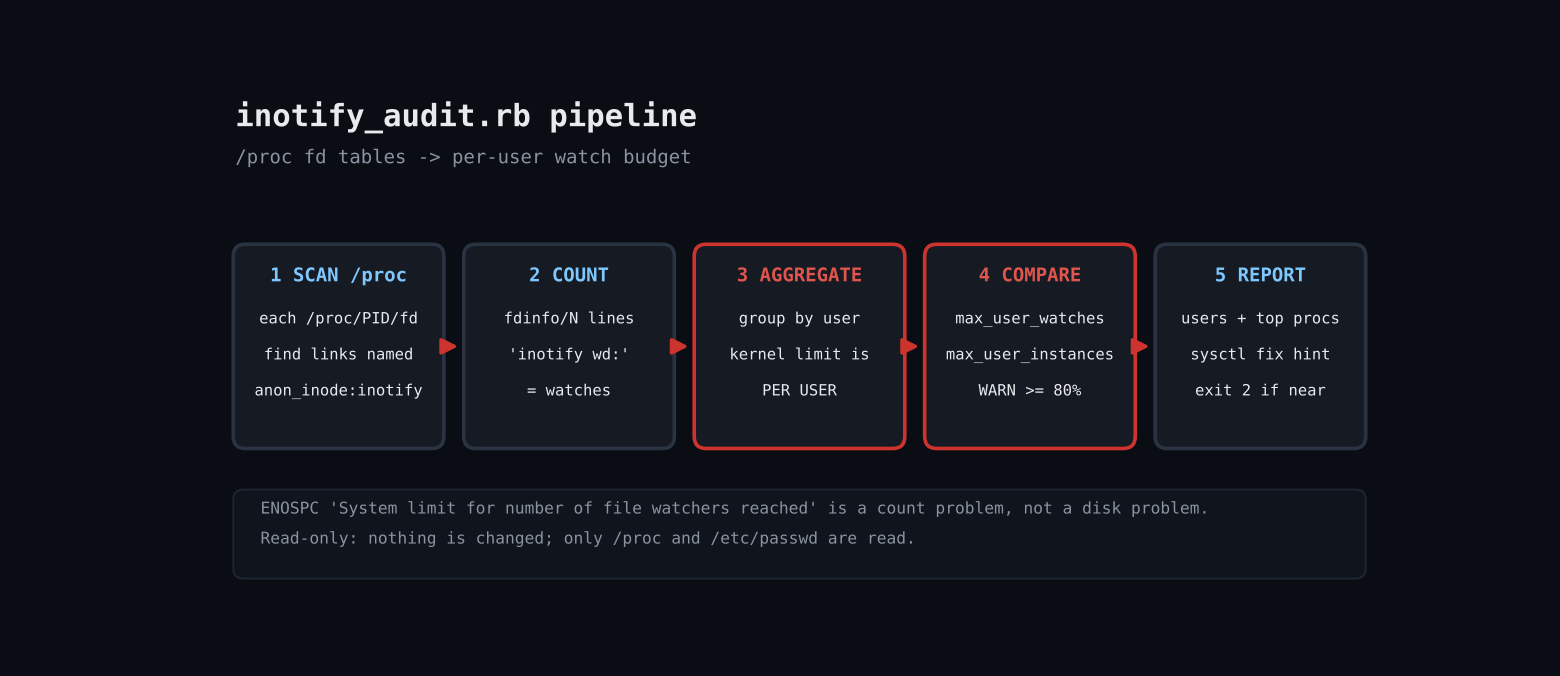
Step through the build below:
The error ENOSPC: System limit for number of file watchers reached has nothing to do with disk space. The kernel caps inotify watches (fs.inotify.max_user_watches) and instances (max_user_instances) per user, and every file-watching tool spends from the same pool. Raising the sysctl blindly hides leaks; this script finds who is spending the watches so you can decide whether to raise the limit or fix a process. It works by walking /proc/PID/fd, spotting inotify descriptors, and counting the inotify wd: lines in the matching fdinfo file.
#!/usr/bin/env ruby
# frozen_string_literal: true
#
# inotify_audit.rb - who is using your inotify watches, and how close are you to the limit?
# "ENOSPC: System limit for number of file watchers reached" (IDEs, webpack, Tail, Syncthing...)
# Ruby 3.0+, stdlib only, Linux. Run as root to see every process.
# Usage: ruby inotify_audit.rb [--top 10] [--warn 80] [--json] [--proc DIR]
require 'optparse'
require 'json'
Proc_ = Struct.new(:pid, :user, :comm, :instances, :watches, keyword_init: true)
def read_int(path)
  Integer(File.read(path).strip, 10)
rescue Errno::ENOENT, ArgumentError
  nil
end
def uid_name(uid, cache = {})
  cache[uid] ||= begin
    File.foreach('/etc/passwd') { |l| f = l.split(':'); return (cache[uid] = f[0]) if f[2].to_i == uid }
    uid.to_s
  rescue Errno::ENOENT
    uid.to_s
  end
end
# Every inotify instance is an fd whose /proc/PID/fd/N link reads "anon_inode:inotify".
# Each watch is one "inotify wd:" line in /proc/PID/fdinfo/N.
def scan(proc_root)
  Dir.children(proc_root).grep(/\A\d+\z/).filter_map do |pid|
    fd_dir = File.join(proc_root, pid, 'fd')
    instances = 0
    watches = 0
    begin
      Dir.children(fd_dir).each do |fd|
        next unless File.readlink(File.join(fd_dir, fd)) == 'anon_inode:inotify'
        instances += 1
        File.foreach(File.join(proc_root, pid, 'fdinfo', fd)) { |l| watches += 1 if l.start_with?('inotify wd:') }
      end
    rescue Errno::EACCES, Errno::ENOENT, Errno::ESRCH, Errno::EPERM
      next # process vanished or not ours
    end
    next if instances.zero?
    uid = File.stat(File.join(proc_root, pid)).uid
    comm = File.read(File.join(proc_root, pid, 'comm')).strip rescue '?'
    Proc_.new(pid: pid.to_i, user: uid_name(uid), comm: comm, instances: instances, watches: watches)
  end
end
opts = { top: 10, warn: 80, json: false, proc: '/proc' }
OptionParser.new do |o|
  o.on('--top N', Integer) { |v| opts[:top] = v }
  o.on('--warn PCT', Integer) { |v| opts[:warn] = v }
  o.on('--json') { opts[:json] = true }
  o.on('--proc DIR', 'procfs root (for testing)') { |v| opts[:proc] = v }
end.parse!
max_watches   = read_int(File.join(opts[:proc], 'sys/fs/inotify/max_user_watches'))   || read_int('/proc/sys/fs/inotify/max_user_watches')
max_instances = read_int(File.join(opts[:proc], 'sys/fs/inotify/max_user_instances')) || read_int('/proc/sys/fs/inotify/max_user_instances')
procs = scan(opts[:proc])
# The kernel limits are PER USER, so aggregate by user before comparing.
users = procs.group_by(&:user).map do |u, ps|
  w = ps.sum(&:watches)
  i = ps.sum(&:instances)
  { user: u, watches: w, instances: i,
    watch_pct: (100.0 * w / max_watches).round(1), inst_pct: (100.0 * i / max_instances).round(1) }
end.sort_by { |u| -u[:watches] }
top = procs.sort_by { |p| -p.watches }.first(opts[:top])
flagged = users.select { |u| [u[:watch_pct], u[:inst_pct]].max >= opts[:warn] }
if opts[:json]
  puts JSON.pretty_generate(limits: { max_user_watches: max_watches, max_user_instances: max_instances },
                            users: users, top_processes: top.map(&:to_h), flagged: flagged.map { |u| u[:user] })
else
  puts "Limits (per user): max_user_watches=#{max_watches} max_user_instances=#{max_instances}"
  puts format("\n%-12s %9s %7s %9s %7s", 'USER', 'WATCHES', 'WATCH%', 'INSTANCES', 'INST%')
  users.each { |u| puts format('%-12s %9d %6.1f%% %9d %6.1f%%%s', u[:user], u[:watches], u[:watch_pct], u[:instances], u[:inst_pct], flagged.include?(u) ? '  <-- NEAR LIMIT' : '') }
  puts format("\n%-7s %-12s %-18s %9s %9s", 'PID', 'USER', 'COMMAND', 'WATCHES', 'INSTANCES')
  top.each { |p| puts format('%-7d %-12s %-18s %9d %9d', p.pid, p.user, p.comm, p.watches, p.instances) }
  puts "\nFix: sudo sysctl fs.inotify.max_user_watches=524288  (persist in /etc/sysctl.d/)" if flagged.any?
end
exit(flagged.any? ? 2 : 0)
1. Find inotify descriptors — For each numeric directory in /proc, File.readlink on every fd. An inotify instance resolves to the literal string anon_inode:inotify.
2. Count watches — The matching /proc/PID/fdinfo/N file has one inotify wd: line per watch, so counting lines gives the watch count with no ptrace and no external tools.
3. Handle races — Processes exit while you scan; ENOENT, ESRCH and EACCES are rescued per process so one vanished PID never aborts the run.
4. Aggregate per user — The kernel limit is per UID, so processes are grouped by owner (resolved via /etc/passwd) before computing percentages of both limits.
5. Report — A per-user table, the top N processes, and a sysctl hint when any user is over --warn percent. Exit code 2 makes it usable as a monitoring check.
$ ruby inotify_audit.rb (captured in sandbox)
$ ruby inotify_audit.rb --top 5
Limits (per user): max_user_watches=64818 max_user_instances=128
USER           WATCHES  WATCH% INSTANCES   INST%
root                 8    0.0%         2    1.6%
PID     USER         COMMAND              WATCHES INSTANCES
403     root         python3                    6         1
81      root         claude                     2         1
$ ruby inotify_audit.rb --warn 1 --top 1   # lowered threshold to show the alert path
Limits (per user): max_user_watches=64818 max_user_instances=128
USER           WATCHES  WATCH% INSTANCES   INST%
root                 8    0.0%         2    1.6%  <-- NEAR LIMIT
PID     USER         COMMAND              WATCHES INSTANCES
439     root         python3                    6         1
Fix: sudo sysctl fs.inotify.max_user_watches=524288  (persist in /etc/sysctl.d/)
Full script + README on GitHub: ruby-devops-toolkit/inotify-limit-audit
Why this matters
The error ENOSPC: System limit for number of file watchers reached has nothing to do with disk space. The kernel caps inotify watches (fs.inotify.max_user_watches) and instances (max_user_instances) per user, and every file-watching tool spends from the same pool. Raising the sysctl blindly hides leaks; this script finds who is spending the watches so you can decide whether to raise the limit or fix a process. It works by walking /proc/PID/fd, spotting inotify descriptors, and counting the inotify wd: lines in the matching fdinfo file.
What you need
- Ruby 3.0+ (tested on 3.3.6), stdlib only
- Linux with procfs; run as root to see every user’s processes
- Optional:
--proc DIRto point at a copy of a procfs tree
Complete code
#!/usr/bin/env ruby
# frozen_string_literal: true
#
# inotify_audit.rb - who is using your inotify watches, and how close are you to the limit?
# "ENOSPC: System limit for number of file watchers reached" (IDEs, webpack, Tail, Syncthing...)
# Ruby 3.0+, stdlib only, Linux. Run as root to see every process.
# Usage: ruby inotify_audit.rb [--top 10] [--warn 80] [--json] [--proc DIR]
require 'optparse'
require 'json'
Proc_ = Struct.new(:pid, :user, :comm, :instances, :watches, keyword_init: true)
def read_int(path)
  Integer(File.read(path).strip, 10)
rescue Errno::ENOENT, ArgumentError
  nil
end
def uid_name(uid, cache = {})
  cache[uid] ||= begin
    File.foreach('/etc/passwd') { |l| f = l.split(':'); return (cache[uid] = f[0]) if f[2].to_i == uid }
    uid.to_s
  rescue Errno::ENOENT
    uid.to_s
  end
end
# Every inotify instance is an fd whose /proc/PID/fd/N link reads "anon_inode:inotify".
# Each watch is one "inotify wd:" line in /proc/PID/fdinfo/N.
def scan(proc_root)
  Dir.children(proc_root).grep(/\A\d+\z/).filter_map do |pid|
    fd_dir = File.join(proc_root, pid, 'fd')
    instances = 0
    watches = 0
    begin
      Dir.children(fd_dir).each do |fd|
        next unless File.readlink(File.join(fd_dir, fd)) == 'anon_inode:inotify'
        instances += 1
        File.foreach(File.join(proc_root, pid, 'fdinfo', fd)) { |l| watches += 1 if l.start_with?('inotify wd:') }
      end
    rescue Errno::EACCES, Errno::ENOENT, Errno::ESRCH, Errno::EPERM
      next # process vanished or not ours
    end
    next if instances.zero?
    uid = File.stat(File.join(proc_root, pid)).uid
    comm = File.read(File.join(proc_root, pid, 'comm')).strip rescue '?'
    Proc_.new(pid: pid.to_i, user: uid_name(uid), comm: comm, instances: instances, watches: watches)
  end
end
opts = { top: 10, warn: 80, json: false, proc: '/proc' }
OptionParser.new do |o|
  o.on('--top N', Integer) { |v| opts[:top] = v }
  o.on('--warn PCT', Integer) { |v| opts[:warn] = v }
  o.on('--json') { opts[:json] = true }
  o.on('--proc DIR', 'procfs root (for testing)') { |v| opts[:proc] = v }
end.parse!
max_watches   = read_int(File.join(opts[:proc], 'sys/fs/inotify/max_user_watches'))   || read_int('/proc/sys/fs/inotify/max_user_watches')
max_instances = read_int(File.join(opts[:proc], 'sys/fs/inotify/max_user_instances')) || read_int('/proc/sys/fs/inotify/max_user_instances')
procs = scan(opts[:proc])
# The kernel limits are PER USER, so aggregate by user before comparing.
users = procs.group_by(&:user).map do |u, ps|
  w = ps.sum(&:watches)
  i = ps.sum(&:instances)
  { user: u, watches: w, instances: i,
    watch_pct: (100.0 * w / max_watches).round(1), inst_pct: (100.0 * i / max_instances).round(1) }
end.sort_by { |u| -u[:watches] }
top = procs.sort_by { |p| -p.watches }.first(opts[:top])
flagged = users.select { |u| [u[:watch_pct], u[:inst_pct]].max >= opts[:warn] }
if opts[:json]
  puts JSON.pretty_generate(limits: { max_user_watches: max_watches, max_user_instances: max_instances },
                            users: users, top_processes: top.map(&:to_h), flagged: flagged.map { |u| u[:user] })
else
  puts "Limits (per user): max_user_watches=#{max_watches} max_user_instances=#{max_instances}"
  puts format("\n%-12s %9s %7s %9s %7s", 'USER', 'WATCHES', 'WATCH%', 'INSTANCES', 'INST%')
  users.each { |u| puts format('%-12s %9d %6.1f%% %9d %6.1f%%%s', u[:user], u[:watches], u[:watch_pct], u[:instances], u[:inst_pct], flagged.include?(u) ? '  <-- NEAR LIMIT' : '') }
  puts format("\n%-7s %-12s %-18s %9s %9s", 'PID', 'USER', 'COMMAND', 'WATCHES', 'INSTANCES')
  top.each { |p| puts format('%-7d %-12s %-18s %9d %9d', p.pid, p.user, p.comm, p.watches, p.instances) }
  puts "\nFix: sudo sysctl fs.inotify.max_user_watches=524288  (persist in /etc/sysctl.d/)" if flagged.any?
end
exit(flagged.any? ? 2 : 0)
Step by step
- Find inotify descriptors. For each numeric directory in
/proc,File.readlinkon every fd. An inotify instance resolves to the literal stringanon_inode:inotify. - Count watches. The matching
/proc/PID/fdinfo/Nfile has oneinotify wd:line per watch, so counting lines gives the watch count with no ptrace and no external tools. - Handle races. Processes exit while you scan;
ENOENT,ESRCHandEACCESare rescued per process so one vanished PID never aborts the run. - Aggregate per user. The kernel limit is per UID, so processes are grouped by owner (resolved via
/etc/passwd) before computing percentages of both limits. - Report. A per-user table, the top N processes, and a sysctl hint when any user is over
--warnpercent. Exit code 2 makes it usable as a monitoring check.
What it prints
$ ruby inotify_audit.rb --top 5
Limits (per user): max_user_watches=64818 max_user_instances=128
USER           WATCHES  WATCH% INSTANCES   INST%
root                 8    0.0%         2    1.6%
PID     USER         COMMAND              WATCHES INSTANCES
403     root         python3                    6         1
81      root         claude                     2         1
$ ruby inotify_audit.rb --warn 1 --top 1   # lowered threshold to show the alert path
Limits (per user): max_user_watches=64818 max_user_instances=128
USER           WATCHES  WATCH% INSTANCES   INST%
root                 8    0.0%         2    1.6%  <-- NEAR LIMIT
PID     USER         COMMAND              WATCHES INSTANCES
439     root         python3                    6         1
Fix: sudo sysctl fs.inotify.max_user_watches=524288  (persist in /etc/sysctl.d/)
When it misbehaves
- Only your own processes show up: run with sudo;
fdinfois root-readable for other users. - Zero results on containers: the container’s procfs shows only its PID namespace; run the audit on the host or inside each container.
- Counts differ from sysctl hints online: the limit is per user, so two services under one account share a budget.
- Tested honestly: run on a Linux sandbox with a Python helper holding real inotify watches (see Output tab); the threshold was lowered to demonstrate the alert path.
Where to take it next
- Emit Prometheus metrics (pair with the prometheus-exporter tool in this repo)
- Resolve watched paths by reading
ino:/sdev:from fdinfo - Auto-open a ticket when a user crosses 80%
- Compare against
cgroupmembership to attribute watches to services