

ip -s link shows lifetime counters, which is useless at 3 AM. What you need is “how many packets did eth0 drop in the last ten seconds”. Two reads of /proc/net/dev, one subtraction, and a threshold turn Ruby into a NIC health check that fits any monitoring system.
Full script + README on GitHub: ruby-devops-toolkit/net-iface-monitor
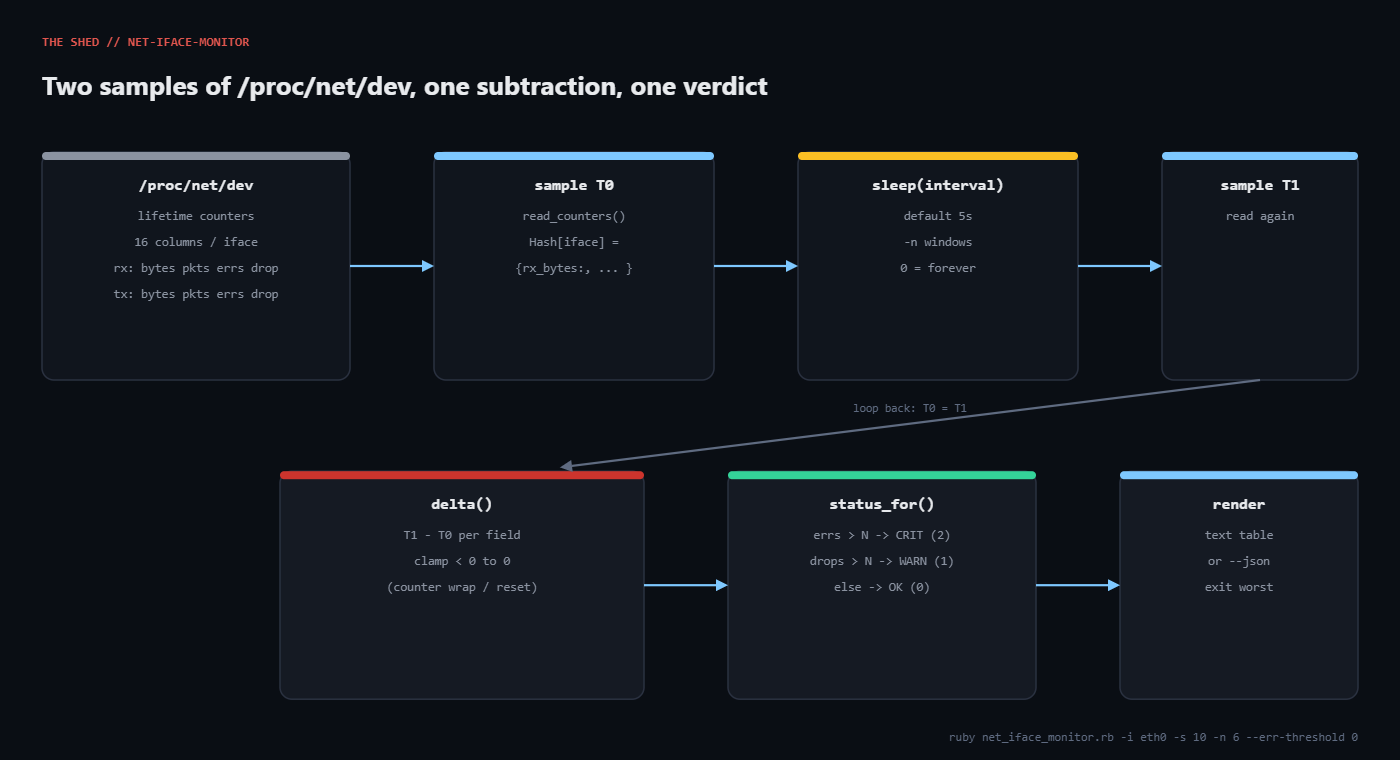
Step through the build below:
Intermittent packet loss is one of the nastiest things to diagnose because everything above the NIC looks healthy: the service is up, the load balancer is green, the box has CPU to spare. Meanwhile the kernel is quietly incrementing rx_drop because a ring buffer is too small, or rx_errs because a cable or SFP is failing.
Those counters are all in /proc/net/dev, but they are cumulative since boot. A drop count of 340 tells you nothing unless you know what it was ten seconds ago. This script samples the file, sleeps, samples again, and reports the delta as a rate plus a status: OK, WARN (drops over threshold) or CRIT (any errors). The exit code matches, so Nagios, Icinga, a systemd timer or a plain cron job can all use it unchanged.
#!/usr/bin/env ruby
# frozen_string_literal: true
#
# net_iface_monitor.rb - Sample /proc/net/dev and report per-interface
# throughput, packet rates and (most importantly) error/drop deltas, with
# optional threshold alerts and a Nagios-style exit code.
#
# Why not just run `ip -s link`? Because that prints lifetime counters.
# The number you care about at 3 AM is "how many packets did eth0 DROP in
# the last 10 seconds", and that requires two samples and a subtraction.
#
# Usage:
#   ruby net_iface_monitor.rb                       # one 5-second sample, all real NICs
#   ruby net_iface_monitor.rb -i eth0 -n 3 -s 10    # eth0 only, three 10s windows
#   ruby net_iface_monitor.rb --drop-threshold 0 --err-threshold 0   # alert on ANY drop/err
#   ruby net_iface_monitor.rb --json                # machine-readable, one object per window
#   ruby net_iface_monitor.rb --link-state          # add carrier/speed/mtu from sysfs
#
# Exit codes (last window wins): 0 OK, 1 WARNING (drops), 2 CRITICAL (errors), 3 usage error.
#
# Tested with Ruby 3.0+ on Ubuntu 22.04. No gems required.
require 'optparse'
require 'json'
require 'time'
# Column order in /proc/net/dev, after the "iface:" token.
RX_FIELDS = %i[rx_bytes rx_packets rx_errs rx_drop rx_fifo rx_frame rx_compressed rx_multicast].freeze
TX_FIELDS = %i[tx_bytes tx_packets tx_errs tx_drop tx_fifo tx_colls tx_carrier tx_compressed].freeze
FIELDS = (RX_FIELDS + TX_FIELDS).freeze
opts = {
  ifaces: nil, interval: 5, count: 1, json: false, link: false,
  drop_threshold: 10, err_threshold: 0, include_virtual: false,
  proc_path: '/proc/net/dev'
}
OptionParser.new do |o|
  o.banner = 'Usage: net_iface_monitor.rb [options]'
  o.on('-i', '--iface LIST', Array, 'Comma-separated interfaces (default: all physical)') { |v| opts[:ifaces] = v }
  o.on('-s', '--interval SEC', Float, 'Seconds per sample window (default 5)') { |v| opts[:interval] = v }
  o.on('-n', '--count N', Integer, 'Number of windows to sample (default 1, 0 = forever)') { |v| opts[:count] = v }
  o.on('--drop-threshold N', Integer, 'WARNING if rx+tx drops in a window exceed N (default 10)') { |v| opts[:drop_threshold] = v }
  o.on('--err-threshold N', Integer, 'CRITICAL if rx+tx errors in a window exceed N (default 0)') { |v| opts[:err_threshold] = v }
  o.on('--include-virtual', 'Also show lo, docker*, veth*, br-*, virbr*') { opts[:include_virtual] = true }
  o.on('--link-state', 'Read carrier/speed/mtu/operstate from /sys/class/net') { opts[:link] = true }
  o.on('--json', 'Emit one JSON document per window') { opts[:json] = true }
  o.on('--proc-path PATH', 'Alternate /proc/net/dev (for testing)') { |v| opts[:proc_path] = v }
  o.on('-h', '--help') { puts o; exit 3 }
end.parse!
VIRTUAL = /\A(lo|docker\d*|veth|br-|virbr|tun|tap|wg\d|flannel|cni|kube)/.freeze
# ---------------------------------------------------------------------------
# Reading counters
# ---------------------------------------------------------------------------
def read_counters(path)
  File.readlines(path).drop(2).each_with_object({}) do |line, h|
    name, rest = line.split(':', 2)
    next unless rest
    values = rest.split.map(&:to_i)
    next unless values.size >= FIELDS.size
    h[name.strip] = FIELDS.zip(values).to_h
  end
rescue Errno::ENOENT, Errno::EACCES => e
  warn "cannot read #{path}: #{e.message}"
  exit 3
end
def link_state(iface)
  base = "/sys/class/net/#{iface}"
  read = ->(f) { File.read("#{base}/#{f}").strip rescue 'n/a' }
  { operstate: read.call('operstate'), carrier: read.call('carrier'),
    speed_mbps: read.call('speed'), mtu: read.call('mtu') }
end
# ---------------------------------------------------------------------------
# Delta maths
# ---------------------------------------------------------------------------
# Counters are unsigned 64-bit and can wrap; a negative delta means a wrap
# (or an interface reset), so clamp to zero rather than reporting nonsense.
def delta(after, before)
  FIELDS.each_with_object({}) { |f, h| h[f] = [after[f] - before[f], 0].max }
end
def human_rate(bytes, secs)
  bps = bytes * 8.0 / secs
  units = %w[bps Kbps Mbps Gbps Tbps]
  i = 0
  while bps >= 1000 && i < units.size - 1
    bps /= 1000
    i += 1
  end
  format('%6.1f %-4s', bps, units[i])
end
def select_ifaces(counters, opts)
  names = counters.keys
  names = names.reject { |n| n.match?(VIRTUAL) } unless opts[:include_virtual]
  names &= opts[:ifaces] if opts[:ifaces]
  names.sort
end
def status_for(d, opts)
  errs = d[:rx_errs] + d[:tx_errs]
  drops = d[:rx_drop] + d[:tx_drop]
  return [2, 'CRIT'] if errs > opts[:err_threshold]
  return [1, 'WARN'] if drops > opts[:drop_threshold]
  [0, 'OK']
end
# ---------------------------------------------------------------------------
# Rendering
# ---------------------------------------------------------------------------
def render_text(rows, secs, window_no)
  puts "window #{window_no}  (#{secs}s)  #{Time.now.strftime('%H:%M:%S')}"
  puts format('  %-10s %-6s %12s %12s %8s %8s %6s %6s %6s %6s', 'IFACE', 'STATE', 'RX', 'TX', 'RX pkt/s', 'TX pkt/s', 'RXerr', 'TXerr', 'RXdrp', 'TXdrp')
  rows.each do |r|
    d = r[:delta]
    puts format('  %-10s %-6s %12s %12s %8.0f %8.0f %6d %6d %6d %6d',
                r[:iface], r[:status], human_rate(d[:rx_bytes], secs), human_rate(d[:tx_bytes], secs),
                d[:rx_packets] / secs, d[:tx_packets] / secs,
                d[:rx_errs], d[:tx_errs], d[:rx_drop], d[:tx_drop])
    next unless r[:link]
    l = r[:link]
    puts format('  %-10s link: %s carrier=%s speed=%sMb mtu=%s', '', l[:operstate], l[:carrier], l[:speed_mbps], l[:mtu])
  end
  puts
end
# ---------------------------------------------------------------------------
# Main loop
# ---------------------------------------------------------------------------
worst = 0
window = 0
before = read_counters(opts[:proc_path])
loop do
  window += 1
  sleep opts[:interval]
  after = read_counters(opts[:proc_path])
  secs = opts[:interval]
  rows = select_ifaces(after, opts).filter_map do |iface|
    next unless before[iface]
    d = delta(after[iface], before[iface])
    code, label = status_for(d, opts)
    worst = [worst, code].max
    { iface: iface, status: label, code: code, delta: d,
      link: opts[:link] ? link_state(iface) : nil }
  end
  if opts[:json]
    puts JSON.generate(window: window, seconds: secs, at: Time.now.iso8601,
                       interfaces: rows.map { |r| r.reject { |k, _| k == :code } })
  else
    render_text(rows, secs, window)
  end
  before = after
  break if opts[:count].positive? && window >= opts[:count]
end
exit worst
Read the file, not a command. /proc/net/dev is a fixed-format text table: two header lines, then one line per interface with 16 integers after iface:. read_counters zips those integers against a constant list of field names, so the rest of the script talks about d[:rx_drop] instead of “column 4”.
Clamp negative deltas. Counters are unsigned 64-bit and can wrap; more commonly an interface gets reset (driver reload, VM migration) and the counters go back to zero. A naive subtraction then reports minus eight billion bytes. delta clamps every field at zero.
Virtual interfaces are hidden by default. On a Docker or Kubernetes host, /proc/net/dev can list hundreds of veth* pairs. The VIRTUAL regex filters them unless you pass --include-virtual.
--proc-path exists purely for testing. The sandbox this ran in has only lo, so the output tab was produced by pointing the script at a hand-written copy of /proc/net/dev and mutating it between samples with sed from a background shell. Same code path, believable numbers.
$ ruby net_iface_monitor.rb -s 2 -n 1 --drop-threshold 10
window 1  (2.0s)  15:44:34
  IFACE      STATE            RX           TX RX pkt/s TX pkt/s  RXerr  TXerr  RXdrp  TXdrp
  eth0       CRIT     250.0 Mbps   120.0 Mbps    25500    10500      3      0     62      0
  eth1       OK         1.0 Mbps     1.6 Mbps     1000     1250      0      0      0      0
exit=2  (2 = CRITICAL: eth0 logged RX errors)
$ ruby net_iface_monitor.rb -s 1 -n 1 --json
{
    "window": 1,
    "seconds": 1.0,
    "at": "2026-09-06T15:44:35-05:00",
    "interfaces": [
        {
            "iface": "eth0",
            "status": "OK",
            "delta": {
                "rx_bytes": 0,
                "rx_packets": 0,
                "rx_errs": 0,
                "rx_drop": 0,
                "rx_fifo": 0,
                "rx_frame": 0,
                "rx_compressed": 0,
                "rx_multicast": 0,
                "tx_bytes": 0,
                "tx_packets": 0,
                "tx_errs": 0,
                "tx_drop": 0,
                "tx_fifo": 0,
                "tx_colls": 0,
                "tx_carrier": 0,
                "tx_compressed": 0
            },
            "link": null
        },
        {
            "iface": "eth1",
Prerequisites
- Ruby 3.0+, stdlib only (
optparse,json,time). - Linux with procfs mounted (every mainstream distro).
--link-stateadditionally reads/sys/class/net/<iface>/{operstate,carrier,speed,mtu}. - No root needed;
/proc/net/devis world-readable. Inside a container you only see the container’s network namespace.
Full source for reference
Usage:
ruby net_iface_monitor.rb                       # one 5s window, all physical NICs
ruby net_iface_monitor.rb -i eth0 -n 3 -s 10    # eth0 only, three 10s windows
ruby net_iface_monitor.rb --drop-threshold 0 --err-threshold 0   # alert on ANY drop/err
ruby net_iface_monitor.rb --json -n 0 -s 10     # stream JSON forever
ruby net_iface_monitor.rb --link-state # add carrier/speed/mtu from sysfs#!/usr/bin/env ruby
# frozen_string_literal: true
#
# net_iface_monitor.rb - Sample /proc/net/dev and report per-interface
# throughput, packet rates and (most importantly) error/drop deltas, with
# optional threshold alerts and a Nagios-style exit code.
#
# Why not just run `ip -s link`? Because that prints lifetime counters.
# The number you care about at 3 AM is "how many packets did eth0 DROP in
# the last 10 seconds", and that requires two samples and a subtraction.
#
# Usage:
# ruby net_iface_monitor.rb # one 5-second sample, all real NICs
# ruby net_iface_monitor.rb -i eth0 -n 3 -s 10 # eth0 only, three 10s windows
# ruby net_iface_monitor.rb --drop-threshold 0 --err-threshold 0 # alert on ANY drop/err
# ruby net_iface_monitor.rb --json # machine-readable, one object per window
# ruby net_iface_monitor.rb --link-state # add carrier/speed/mtu from sysfs
#
# Exit codes (last window wins): 0 OK, 1 WARNING (drops), 2 CRITICAL (errors), 3 usage error.
#
# Tested with Ruby 3.0+ on Ubuntu 22.04. No gems required.
require 'optparse'
require 'json'
require 'time'
# Column order in /proc/net/dev, after the "iface:" token.
RX_FIELDS = %i[rx_bytes rx_packets rx_errs rx_drop rx_fifo rx_frame rx_compressed rx_multicast].freeze
TX_FIELDS = %i[tx_bytes tx_packets tx_errs tx_drop tx_fifo tx_colls tx_carrier tx_compressed].freeze
FIELDS = (RX_FIELDS + TX_FIELDS).freeze
opts = {
ifaces: nil, interval: 5, count: 1, json: false, link: false,
drop_threshold: 10, err_threshold: 0, include_virtual: false,
proc_path: '/proc/net/dev'
}
OptionParser.new do |o|
o.banner = 'Usage: net_iface_monitor.rb [options]'
o.on('-i', '--iface LIST', Array, 'Comma-separated interfaces (default: all physical)') { |v| opts[:ifaces] = v }
o.on('-s', '--interval SEC', Float, 'Seconds per sample window (default 5)') { |v| opts[:interval] = v }
o.on('-n', '--count N', Integer, 'Number of windows to sample (default 1, 0 = forever)') { |v| opts[:count] = v }
o.on('--drop-threshold N', Integer, 'WARNING if rx+tx drops in a window exceed N (default 10)') { |v| opts[:drop_threshold] = v }
o.on('--err-threshold N', Integer, 'CRITICAL if rx+tx errors in a window exceed N (default 0)') { |v| opts[:err_threshold] = v }
o.on('--include-virtual', 'Also show lo, docker*, veth*, br-*, virbr*') { opts[:include_virtual] = true }
o.on('--link-state', 'Read carrier/speed/mtu/operstate from /sys/class/net') { opts[:link] = true }
o.on('--json', 'Emit one JSON document per window') { opts[:json] = true }
o.on('--proc-path PATH', 'Alternate /proc/net/dev (for testing)') { |v| opts[:proc_path] = v }
o.on('-h', '--help') { puts o; exit 3 }
end.parse!
VIRTUAL = /\A(lo|docker\d*|veth|br-|virbr|tun|tap|wg\d|flannel|cni|kube)/.freeze
# ---------------------------------------------------------------------------
# Reading counters
# ---------------------------------------------------------------------------
def read_counters(path)
File.readlines(path).drop(2).each_with_object({}) do |line, h|
name, rest = line.split(':', 2)
next unless rest
values = rest.split.map(&:to_i)
next unless values.size >= FIELDS.size
h[name.strip] = FIELDS.zip(values).to_h
end
rescue Errno::ENOENT, Errno::EACCES => e
warn "cannot read #{path}: #{e.message}"
exit 3
end
def link_state(iface)
base = "/sys/class/net/#{iface}"
read = ->(f) { File.read("#{base}/#{f}").strip rescue 'n/a' }
{ operstate: read.call('operstate'), carrier: read.call('carrier'),
speed_mbps: read.call('speed'), mtu: read.call('mtu') }
end
# ---------------------------------------------------------------------------
# Delta maths
# ---------------------------------------------------------------------------
# Counters are unsigned 64-bit and can wrap; a negative delta means a wrap
# (or an interface reset), so clamp to zero rather than reporting nonsense.
def delta(after, before)
FIELDS.each_with_object({}) { |f, h| h[f] = [after[f] - before[f], 0].max }
end
def human_rate(bytes, secs)
bps = bytes * 8.0 / secs
units = %w[bps Kbps Mbps Gbps Tbps]
i = 0
while bps >= 1000 && i < units.size - 1
bps /= 1000
i += 1
end
format('%6.1f %-4s', bps, units[i])
end
def select_ifaces(counters, opts)
names = counters.keys
names = names.reject { |n| n.match?(VIRTUAL) } unless opts[:include_virtual]
names &= opts[:ifaces] if opts[:ifaces]
names.sort
end
def status_for(d, opts)
errs = d[:rx_errs] + d[:tx_errs]
drops = d[:rx_drop] + d[:tx_drop]
return [2, 'CRIT'] if errs > opts[:err_threshold]
return [1, 'WARN'] if drops > opts[:drop_threshold]
[0, 'OK']
end
# ---------------------------------------------------------------------------
# Rendering
# ---------------------------------------------------------------------------
def render_text(rows, secs, window_no)
puts "window #{window_no} (#{secs}s) #{Time.now.strftime('%H:%M:%S')}"
puts format(' %-10s %-6s %12s %12s %8s %8s %6s %6s %6s %6s', 'IFACE', 'STATE', 'RX', 'TX', 'RX pkt/s', 'TX pkt/s', 'RXerr', 'TXerr', 'RXdrp', 'TXdrp')
rows.each do |r|
d = r[:delta]
puts format(' %-10s %-6s %12s %12s %8.0f %8.0f %6d %6d %6d %6d',
r[:iface], r[:status], human_rate(d[:rx_bytes], secs), human_rate(d[:tx_bytes], secs),
d[:rx_packets] / secs, d[:tx_packets] / secs,
d[:rx_errs], d[:tx_errs], d[:rx_drop], d[:tx_drop])
next unless r[:link]
l = r[:link]
puts format(' %-10s link: %s carrier=%s speed=%sMb mtu=%s', '', l[:operstate], l[:carrier], l[:speed_mbps], l[:mtu])
end
puts
end
# ---------------------------------------------------------------------------
# Main loop
# ---------------------------------------------------------------------------
worst = 0
window = 0
before = read_counters(opts[:proc_path])
loop do
window += 1
sleep opts[:interval]
after = read_counters(opts[:proc_path])
secs = opts[:interval]
rows = select_ifaces(after, opts).filter_map do |iface|
next unless before[iface]
d = delta(after[iface], before[iface])
code, label = status_for(d, opts)
worst = [worst, code].max
{ iface: iface, status: label, code: code, delta: d,
link: opts[:link] ? link_state(iface) : nil }
end
if opts[:json]
puts JSON.generate(window: window, seconds: secs, at: Time.now.iso8601,
interfaces: rows.map { |r| r.reject { |k, _| k == :code } })
else
render_text(rows, secs, window)
end
before = after
break if opts[:count].positive? && window >= opts[:count]
end
exit worst
Step-by-step walkthrough
1. Map the columns once
RX_FIELDS and TX_FIELDS list the sixteen counters in the exact order the kernel prints them (documented in proc(5) and net/core/net-procfs.c). read_counters splits each data line on the first :, converts the rest to integers, and builds { 'eth0' => { rx_bytes: ..., tx_drop: ... } }.
2. Select interfaces
select_ifaces drops anything matching the VIRTUAL regex (lo, docker*, veth*, br-*, virbr*, tun/tap, WireGuard, CNI) unless --include-virtual, then intersects with -i eth0,eth1 if given.
3. Sample, sleep, sample
The main loop keeps before, sleeps --interval seconds, reads after, and computes delta for each selected interface. After rendering, before = after and it repeats for --count windows (0 = run forever, ideal under a systemd service).
4. Classify
status_for returns [2, 'CRIT'] if rx_errs + tx_errs exceeds --err-threshold (default 0: any error is bad), [1, 'WARN'] if drops exceed --drop-threshold (default 10 per window), else OK. The worst code seen across all windows becomes the exit status.
5. Render
human_rate converts bytes-per-window to bps/Kbps/Mbps/Gbps. Text mode prints one row per interface (plus a link-state line with --link-state); --json prints one JSON document per window with the full 16-field delta, which is what you want to feed a time-series store.
What a run looks like
Troubleshooting
- Only
loshows up. You are inside a container or the sandbox; run on the host, or use--include-virtualto see what the namespace has. This is exactly what happened in the Linux test sandbox, hence the simulated/proc/net/devused for the captured output. - Rates look doubled on bonded interfaces.
bond0plus its slaves all appear; use-i bond0to count traffic once. - CRIT on a healthy box. Some virtio and cloud NICs report a handful of
rx_errsduring DHCP renewals. Set--err-threshold 2and watch for sustained counts instead of single blips. - Huge negative-looking numbers before the fix? They are impossible now;
deltaclamps to zero. If a window shows all zeros for an interface, the counters were probably reset mid-window. speedreadsn/a. Virtual and some wireless drivers don’t expose/sys/class/net/X/speed; the value is informational only.
Extending the script
- Run it as a service:
-n 0 --json -s 10under a systemd unit withStandardOutput=append:/var/log/nic-rates.jsonl. - Nagios/Icinga plugin: the exit codes already match; add a one-line
NIC OK - eth0 12.4 Mbps rx, 0 dropssummary as the first output line. - Prometheus textfile collector: write
nic_rx_drop_delta{iface="eth0"} 62style lines to/var/lib/node_exporter/textfile/. - Correlate with ring buffer size: shell out to
ethtool -g eth0when a WARN fires and print the current vs max RX ring so the fix (ethtool -G eth0 rx 4096) is one copy-paste away. - Add
--busy-threshold-mbpsto flag interfaces running near line rate, which is usually the real cause of drops.