

“The CPU is at 90%” tells you almost nothing. This script splits the number into user work, disk waiting, and hypervisor steal, so you know whether to tune code, fix storage, or call your cloud provider.
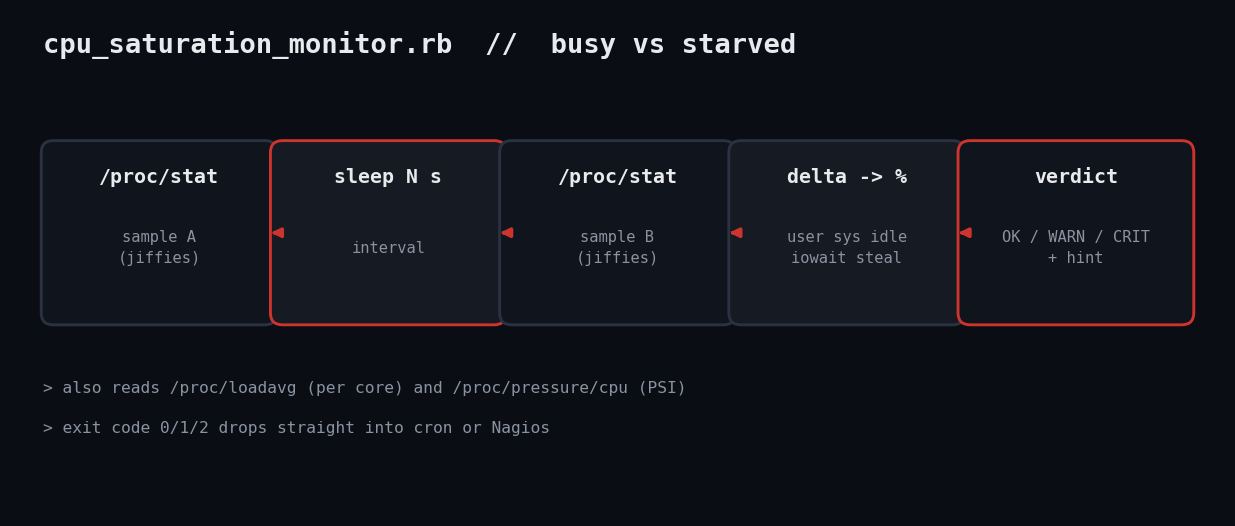
Step through the build below:
The problem: top and load average conflate very different situations. A box with load 8 on 4 cores might be CPU-bound, or stuck waiting on a dead NFS mount (iowait), or losing cycles to a noisy neighbour on a VM (steal). Each has a different fix. This script samples /proc/stat twice, converts the jiffy deltas to percentages, adds load-per-core and kernel PSI pressure, and tells you which one you have.
#!/usr/bin/env ruby
# frozen_string_literal: true
# cpu_saturation_monitor.rb - tell "busy" from "starved" using /proc/stat deltas,
# load average per core and (when available) kernel PSI. Stdlib only.
#
#   ruby cpu_saturation_monitor.rb [--interval 2] [--json]
#   ruby cpu_saturation_monitor.rb --stat-a a.txt --stat-b b.txt [--loadavg f] [--psi f]
# Exit: 0 OK, 1 WARN, 2 CRIT
require 'optparse'
require 'json'
require 'etc'
FIELDS = %i[user nice system idle iowait irq softirq steal].freeze
THRESH = { iowait: [10.0, 25.0], steal: [5.0, 15.0], busy: [85.0, 95.0], load_per_core: [1.0, 2.0] }.freeze
# First "cpu " line of /proc/stat -> hash of jiffies per state
def parse_stat(text)
  line = text.lines.find { |l| l.start_with?('cpu ') } or raise 'no aggregate cpu line'
  FIELDS.zip(line.split[1..8].map(&:to_i)).to_h
end
# Percent of elapsed jiffies spent in each state between two samples
def percentages(a, b)
  delta = FIELDS.to_h { |f| [f, b[f] - a[f]] }
  total = delta.values.sum
  raise 'no CPU time elapsed between samples' if total <= 0
  pct = delta.transform_values { |v| (v * 100.0 / total).round(1) }
  pct[:busy] = (100.0 - pct[:idle] - pct[:iowait]).round(1)
  pct
end
def level(metric, value)
  warn_at, crit_at = THRESH.fetch(metric)
  return 2 if value >= crit_at
  value >= warn_at ? 1 : 0
end
def psi_cpu(text)
  return nil unless text
  some = text.lines.find { |l| l.start_with?('some') } or return nil
  some[/avg10=([\d.]+)/, 1].to_f
end
def evaluate(pct, load1, cores, psi)
  checks = {
    busy:          [pct[:busy], level(:busy, pct[:busy])],
    iowait:        [pct[:iowait], level(:iowait, pct[:iowait])],
    steal:         [pct[:steal], level(:steal, pct[:steal])],
    load_per_core: [(load1 / cores).round(2), level(:load_per_core, load1 / cores)]
  }
  checks[:psi_some_avg10] = [psi, psi >= 40 ? 2 : (psi >= 10 ? 1 : 0)] if psi
  checks
end
HINT = {
  iowait: 'CPUs are waiting on disk/NFS - look at iostat, not at the CPU',
  steal: 'hypervisor is taking cycles - noisy neighbour or oversold host',
  busy: 'genuinely CPU-bound - find the hot process (top / pidstat)',
  load_per_core: 'more runnable tasks than cores',
  psi_some_avg10: 'tasks are stalling waiting for CPU time'
}.freeze
if $PROGRAM_NAME == __FILE__
  o = { interval: 2.0, json: false }
  OptionParser.new do |op|
    op.on('--interval N', Float) { |v| o[:interval] = v }
    op.on('--json') { o[:json] = true }
    op.on('--stat-a F') { |v| o[:a] = v }
    op.on('--stat-b F') { |v| o[:b] = v }
    op.on('--loadavg F') { |v| o[:load] = v }
    op.on('--psi F') { |v| o[:psi] = v }
    op.on('--cores N', Integer) { |v| o[:cores] = v }
  end.parse!
  if o[:a]
    a = parse_stat(File.read(o[:a]))
    b = parse_stat(File.read(o[:b]))
  else
    a = parse_stat(File.read('/proc/stat'))
    sleep o[:interval]
    b = parse_stat(File.read('/proc/stat'))
  end
  pct = percentages(a, b)
  load1 = File.read(o[:load] || '/proc/loadavg').split[0].to_f
  cores = o[:cores] || Etc.nprocessors
  psi_path = o[:psi] || '/proc/pressure/cpu'
  psi = psi_cpu(File.exist?(psi_path) ? File.read(psi_path) : nil)
  checks = evaluate(pct, load1, cores, psi)
  worst = checks.values.map(&:last).max
  if o[:json]
    puts JSON.pretty_generate(status: %w[OK WARN CRIT][worst], cores: cores, percent: pct, checks: checks)
  else
    puts format('CPU saturation (%d cores, load1 %.2f)', cores, load1)
    checks.each do |name, (val, lvl)|
      puts format('  %-4s %-15s %6.2f  %s', %w[OK WARN CRIT][lvl], name, val, lvl.zero? ? '' : HINT[name])
    end
    puts "RESULT: #{%w[OK WARN CRIT][worst]}"
  end
  exit worst
end
1. Read the aggregate cpu line twice, N seconds apart. 2. Subtract to get jiffies spent per state, divide by the total: percentages. 3. “Busy” = 100 – idle – iowait, since iowait is idle time with a pending I/O. 4. Compare each metric to WARN/CRIT thresholds, attach a hint, exit 0/1/2. Offline flags (--stat-a/--stat-b) make it testable with fixture files.
CPU saturation (4 cores, load1 6.40)
  OK   busy             51.40
  CRIT iowait           32.40  CPUs are waiting on disk/NFS - look at iostat, not at the CPU
  CRIT steal            18.40  hypervisor is taking cycles - noisy neighbour or oversold host
  WARN load_per_core     1.60  more runnable tasks than cores
  WARN psi_some_avg10   22.50  tasks are stalling waiting for CPU time
RESULT: CRIT
Full script + README on GitHub: ruby-devops-toolkit/cpu-saturation-monitor
What you need
- Ruby 3.0+ (tested on 3.3.6), Linux with
/proc - No gems: only
optparse,json,etc - Optional:
/proc/pressure/cpu(kernel 4.20+ with PSI enabled)
Full code
#!/usr/bin/env ruby
# frozen_string_literal: true
# cpu_saturation_monitor.rb - tell "busy" from "starved" using /proc/stat deltas,
# load average per core and (when available) kernel PSI. Stdlib only.
#
#   ruby cpu_saturation_monitor.rb [--interval 2] [--json]
#   ruby cpu_saturation_monitor.rb --stat-a a.txt --stat-b b.txt [--loadavg f] [--psi f]
# Exit: 0 OK, 1 WARN, 2 CRIT
require 'optparse'
require 'json'
require 'etc'
FIELDS = %i[user nice system idle iowait irq softirq steal].freeze
THRESH = { iowait: [10.0, 25.0], steal: [5.0, 15.0], busy: [85.0, 95.0], load_per_core: [1.0, 2.0] }.freeze
# First "cpu " line of /proc/stat -> hash of jiffies per state
def parse_stat(text)
  line = text.lines.find { |l| l.start_with?('cpu ') } or raise 'no aggregate cpu line'
  FIELDS.zip(line.split[1..8].map(&:to_i)).to_h
end
# Percent of elapsed jiffies spent in each state between two samples
def percentages(a, b)
  delta = FIELDS.to_h { |f| [f, b[f] - a[f]] }
  total = delta.values.sum
  raise 'no CPU time elapsed between samples' if total <= 0
  pct = delta.transform_values { |v| (v * 100.0 / total).round(1) }
  pct[:busy] = (100.0 - pct[:idle] - pct[:iowait]).round(1)
  pct
end
def level(metric, value)
  warn_at, crit_at = THRESH.fetch(metric)
  return 2 if value >= crit_at
  value >= warn_at ? 1 : 0
end
def psi_cpu(text)
  return nil unless text
  some = text.lines.find { |l| l.start_with?('some') } or return nil
  some[/avg10=([\d.]+)/, 1].to_f
end
def evaluate(pct, load1, cores, psi)
  checks = {
    busy:          [pct[:busy], level(:busy, pct[:busy])],
    iowait:        [pct[:iowait], level(:iowait, pct[:iowait])],
    steal:         [pct[:steal], level(:steal, pct[:steal])],
    load_per_core: [(load1 / cores).round(2), level(:load_per_core, load1 / cores)]
  }
  checks[:psi_some_avg10] = [psi, psi >= 40 ? 2 : (psi >= 10 ? 1 : 0)] if psi
  checks
end
HINT = {
  iowait: 'CPUs are waiting on disk/NFS - look at iostat, not at the CPU',
  steal: 'hypervisor is taking cycles - noisy neighbour or oversold host',
  busy: 'genuinely CPU-bound - find the hot process (top / pidstat)',
  load_per_core: 'more runnable tasks than cores',
  psi_some_avg10: 'tasks are stalling waiting for CPU time'
}.freeze
if $PROGRAM_NAME == __FILE__
  o = { interval: 2.0, json: false }
  OptionParser.new do |op|
    op.on('--interval N', Float) { |v| o[:interval] = v }
    op.on('--json') { o[:json] = true }
    op.on('--stat-a F') { |v| o[:a] = v }
    op.on('--stat-b F') { |v| o[:b] = v }
    op.on('--loadavg F') { |v| o[:load] = v }
    op.on('--psi F') { |v| o[:psi] = v }
    op.on('--cores N', Integer) { |v| o[:cores] = v }
  end.parse!
  if o[:a]
    a = parse_stat(File.read(o[:a]))
    b = parse_stat(File.read(o[:b]))
  else
    a = parse_stat(File.read('/proc/stat'))
    sleep o[:interval]
    b = parse_stat(File.read('/proc/stat'))
  end
  pct = percentages(a, b)
  load1 = File.read(o[:load] || '/proc/loadavg').split[0].to_f
  cores = o[:cores] || Etc.nprocessors
  psi_path = o[:psi] || '/proc/pressure/cpu'
  psi = psi_cpu(File.exist?(psi_path) ? File.read(psi_path) : nil)
  checks = evaluate(pct, load1, cores, psi)
  worst = checks.values.map(&:last).max
  if o[:json]
    puts JSON.pretty_generate(status: %w[OK WARN CRIT][worst], cores: cores, percent: pct, checks: checks)
  else
    puts format('CPU saturation (%d cores, load1 %.2f)', cores, load1)
    checks.each do |name, (val, lvl)|
      puts format('  %-4s %-15s %6.2f  %s', %w[OK WARN CRIT][lvl], name, val, lvl.zero? ? '' : HINT[name])
    end
    puts "RESULT: #{%w[OK WARN CRIT][worst]}"
  end
  exit worst
end
How it works, step by step
Parsing. The first line of /proc/stat starts with cpu and lists cumulative jiffies for user, nice, system, idle, iowait, irq, softirq, steal. parse_stat zips those into a hash; zipping with a symbol list keeps the mapping explicit.
Deltas. The counters only ever grow, so a single sample is useless; percentages subtracts sample A from B and divides by the total elapsed jiffies. It raises if no time elapsed, which would otherwise divide by zero.
Judging. THRESH is a table of [warn, crit] pairs and level returns 0/1/2. Load is divided by Etc.nprocessors so the same threshold works on a 2-core VM and a 64-core server. PSI some avg10 is the share of time at least one task stalled waiting for CPU.
Output. Each non-OK line carries a hint pointing at the right next tool, and the worst level becomes the exit status.
Running it
When things go sideways
- All zeros on a quiet box: normal. Raise
--intervalfor a steadier sample. - No PSI line: the kernel lacks PSI or booted with
psi=0; the check is skipped, not failed. - Containers:
/proc/statshows the host. Use cgroup files for per-container numbers. - Testing note: verified in the Linux sandbox with a live run and with hand-built fixture files exercising CRIT iowait/steal.
Where to take it next
- Loop mode that keeps a rolling window and alerts on sustained saturation
- Per-core breakdown from the
cpuNlines to spot one pinned core - Push metrics into the Prometheus exporter in this toolkit