

Build a real Prometheus /metrics endpoint in pure Ruby — no prometheus-client gem, no framework, just TCPServer and the standard library.
Step through the build below:
Every monitoring stack eventually needs “just one more metric” from a box that doesn’t have an exporter for it — a custom queue depth, an app-specific counter, a stat some vendor exporter doesn’t expose.
prometheus_exporter.rb builds the whole exporter pattern — registry, collectors, HTTP handler, text format — in pure Ruby: no prometheus-client gem, no Sinatra, no WEBrick. Just TCPServer and enough hand-rolled HTTP to serve a /metrics endpoint Prometheus can scrape.
#!/usr/bin/env ruby
# frozen_string_literal: true
#
# prometheus_exporter.rb
#
# A minimal Prometheus "node exporter" written in pure Ruby: it reads system
# stats straight from /proc, serves them as an HTTP /metrics endpoint in the
# Prometheus text exposition format, and needs nothing but the standard
# library -- no `prometheus-client` gem, no Sinatra, no WEBrick.
#
# Why this exists: every monitoring stack eventually needs "just one more
# metric" from a box that doesn't have an exporter for it -- a custom queue
# depth, an app-specific counter, a stat some vendor exporter doesn't expose.
# Reaching for a full framework for that is overkill. This script shows the
# whole exporter pattern (registry -> collectors -> HTTP handler -> text
# format) in ~150 lines you can read in one sitting and bolt custom metrics
# onto directly.
#
# Usage:
#   ruby prometheus_exporter.rb --port 9200
#   curl http://localhost:9200/metrics
#
# Then point Prometheus at it with a scrape config:
#   scrape_configs:
#     - job_name: 'ruby_node_exporter'
#       static_configs:
#         - targets: ['localhost:9200']
#
# Requires: Ruby >= 2.7 (stdlib only: socket, optparse). Reads /proc, so the
# system-stat collectors below are Linux-specific; the HTTP server and
# metrics registry are portable to any OS (see the Windows note in
# Troubleshooting for how to swap in WMI-backed collectors there).
require 'socket'
require 'optparse'
# --- Metric registry --------------------------------------------------------
#
# A tiny stand-in for what `prometheus-client` gives you: named metrics with
# help text and a type, rendered in the Prometheus text exposition format.
# Real Prometheus metric types (counter, gauge) are represented here just
# well enough to be correct for scraping -- this is deliberately not a full
# client library.
class MetricsRegistry
  Metric = Struct.new(:name, :help, :type, :value_fn)
  def initialize
    @metrics = []
  end
  # Registers a gauge: a value that can go up or down (e.g. current memory
  # used). `value_fn` is called fresh on every scrape so the exporter always
  # reports live data, not a stale snapshot from startup.
  def gauge(name, help, &value_fn)
    @metrics << Metric.new(name, help, 'gauge', value_fn)
  end
  # Registers a counter: a value that only increases (e.g. total requests
  # served). Prometheus counters are rendered identically to gauges on the
  # wire -- the distinction is purely about how consumers should interpret
  # resets -- but we track the type for the HELP/TYPE header lines.
  def counter(name, help, &value_fn)
    @metrics << Metric.new(name, help, 'counter', value_fn)
  end
  # Renders every registered metric in the Prometheus text exposition
  # format: https://prometheus.io/docs/instrumenting/exposition_formats/
  def render
    lines = []
    @metrics.each do |m|
      value = m.value_fn.call
      next if value.nil? # collector unavailable on this platform -- skip silently
      lines << "# HELP #{m.name} #{m.help}"
      lines << "# TYPE #{m.name} #{m.type}"
      lines << "#{m.name} #{format_value(value)}"
    end
    "#{lines.join("\n")}\n"
  end
  private
  def format_value(v)
    v.is_a?(Float) ? format('%.4f', v) : v.to_s
  end
end
# --- /proc collectors (Linux) -----------------------------------------------
#
# Each method returns nil (rather than raising) when the expected /proc file
# isn't present, so the registry can skip that metric gracefully on
# non-Linux platforms instead of crashing the whole exporter.
module ProcStats
  module_function
  def load_average_1m
    File.read('/proc/loadavg').split(' ').first.to_f
  rescue Errno::ENOENT
    nil
  end
  def memory_total_bytes
    meminfo['MemTotal']
  end
  def memory_available_bytes
    meminfo['MemAvailable']
  end
  def uptime_seconds
    File.read('/proc/uptime').split(' ').first.to_f
  rescue Errno::ENOENT
    nil
  end
  def meminfo
    return {} unless File.exist?('/proc/meminfo')
    File.readlines('/proc/meminfo').each_with_object({}) do |line, acc|
      # Lines look like "MemTotal:       16384000 kB"
      key, rest = line.split(':', 2)
      next unless rest
      kb = rest.strip.split(' ').first.to_i
      acc[key] = kb * 1024 # normalize to bytes, Prometheus convention
    end
  end
end
# --- HTTP server -------------------------------------------------------------
#
# A deliberately tiny HTTP/1.1 server built directly on TCPServer. It only
# understands enough of HTTP to (a) read a request line, (b) drain any
# request headers, and (c) write a well-formed response -- exactly what a
# scrape endpoint needs and nothing more. Each connection is handled on its
# own thread so a slow/stalled scraper client can't block others.
class Exporter
  def initialize(registry, port:, request_counter: nil)
    @registry = registry
    @port = port
    @request_counter = request_counter
  end
  def start
    server = TCPServer.new(@port)
    puts "prometheus_exporter listening on :#{@port} (GET /metrics)"
    loop do
      client = server.accept
      Thread.new(client) { |c| handle(c) }
    end
  ensure
    server&.close
  end
  private
  def handle(client)
    request_line = client.gets
    return unless request_line
    # Drain headers until the blank line that ends an HTTP request; we
    # don't need their contents for this read-only endpoint.
    while (line = client.gets)
      break if line == "\r\n" || line == "\n"
    end
    method, path, = request_line.split(' ')
    if method == 'GET' && path == '/metrics'
      @request_counter&.call
      body = @registry.render
      respond(client, 200, 'OK', 'text/plain; version=0.0.4', body)
    else
      respond(client, 404, 'Not Found', 'text/plain', "not found: #{path}\n")
    end
  rescue StandardError => e
    warn "request error: #{e.message}"
  ensure
    client.close
  end
  def respond(client, code, reason, content_type, body)
    client.write("HTTP/1.1 #{code} #{reason}\r\n")
    client.write("Content-Type: #{content_type}\r\n")
    client.write("Content-Length: #{body.bytesize}\r\n")
    client.write("Connection: close\r\n\r\n")
    client.write(body)
  end
end
# --- CLI entry point ---------------------------------------------------------
if $PROGRAM_NAME == __FILE__
  options = { port: 9200 }
  OptionParser.new do |opts|
    opts.banner = 'Usage: prometheus_exporter.rb [options]'
    opts.on('--port N', Integer, 'Port to listen on (default 9200)') { |v| options[:port] = v }
  end.parse!
  registry = MetricsRegistry.new
  scrape_count = 0
  registry.gauge('node_load1', 'Load average over the last minute') { ProcStats.load_average_1m }
  registry.gauge('node_memory_total_bytes', 'Total physical memory in bytes') { ProcStats.memory_total_bytes }
  registry.gauge('node_memory_available_bytes', 'Available physical memory in bytes') { ProcStats.memory_available_bytes }
  registry.gauge('node_uptime_seconds', 'Seconds since boot') { ProcStats.uptime_seconds }
  registry.gauge('ruby_exporter_process_uptime_seconds', 'Seconds since this exporter process started') do
    (Process.clock_gettime(Process::CLOCK_MONOTONIC) - $exporter_start).round(4)
  end
  # Example custom counter: total number of times this exporter itself has
  # been scraped. This is the pattern you'd copy for an app-specific metric.
  registry.counter('ruby_exporter_scrapes_total', 'Total number of /metrics scrapes served') { scrape_count }
  $exporter_start = Process.clock_gettime(Process::CLOCK_MONOTONIC)
  exporter = Exporter.new(registry, port: options[:port], request_counter: -> { scrape_count += 1 })
  trap('INT') do
    puts "\nShutting down."
    exit
  end
  exporter.start
end
MetricsRegistry stores each metric as a name, help text, type, and a block — not a static value. The block is called fresh on every scrape, so the exporter always reports live data instead of a stale snapshot from process startup.
Collectors in ProcStats read straight from /proc/loadavg, /proc/meminfo, and /proc/uptime, returning nil (not raising) when a file is missing — so the registry can skip a metric gracefully on a platform where it doesn’t apply.
The HTTP layer handles each connection on its own Thread, so one slow scraper can’t block another. It only understands exactly enough HTTP/1.1 to read a request line, drain headers, and write a correct response — a full HTTP library would be massive overkill for a read-only scrape endpoint.
$ ruby prometheus_exporter.rb --port 9200
prometheus_exporter listening on :9200 (GET /metrics)
$ curl http://localhost:9200/metrics
# HELP node_load1 Load average over the last minute
# TYPE node_load1 gauge
node_load1 0.0000
# HELP node_memory_total_bytes Total physical memory in bytes
# TYPE node_memory_total_bytes gauge
node_memory_total_bytes 4105633792
# HELP node_memory_available_bytes Available physical memory in bytes
# TYPE node_memory_available_bytes gauge
node_memory_available_bytes 3671957504
# HELP node_uptime_seconds Seconds since boot
# TYPE node_uptime_seconds gauge
node_uptime_seconds 1443.4700
# HELP ruby_exporter_process_uptime_seconds Seconds since this exporter process started
# TYPE ruby_exporter_process_uptime_seconds gauge
ruby_exporter_process_uptime_seconds 0.9760
# HELP ruby_exporter_scrapes_total Total number of /metrics scrapes served
# TYPE ruby_exporter_scrapes_total counter
ruby_exporter_scrapes_total 1
Full script + README on GitHub: ruby-devops-toolkit/prometheus-exporter
Prerequisites
- Ruby ≥ 2.7 (tested on 3.0.2, stdlib only:
socket,optparse— no gems required) - Linux, for the bundled
/proc-based collectors (the registry and HTTP server themselves are portable to any OS — see Troubleshooting) - A Prometheus server (or just
curl) to scrape the endpoint
Full source
#!/usr/bin/env ruby
# frozen_string_literal: true
#
# prometheus_exporter.rb
#
# A minimal Prometheus "node exporter" written in pure Ruby: it reads system
# stats straight from /proc, serves them as an HTTP /metrics endpoint in the
# Prometheus text exposition format, and needs nothing but the standard
# library -- no `prometheus-client` gem, no Sinatra, no WEBrick.
#
# Why this exists: every monitoring stack eventually needs "just one more
# metric" from a box that doesn't have an exporter for it -- a custom queue
# depth, an app-specific counter, a stat some vendor exporter doesn't expose.
# Reaching for a full framework for that is overkill. This script shows the
# whole exporter pattern (registry -> collectors -> HTTP handler -> text
# format) in ~150 lines you can read in one sitting and bolt custom metrics
# onto directly.
#
# Usage:
#   ruby prometheus_exporter.rb --port 9200
#   curl http://localhost:9200/metrics
#
# Then point Prometheus at it with a scrape config:
#   scrape_configs:
#     - job_name: 'ruby_node_exporter'
#       static_configs:
#         - targets: ['localhost:9200']
#
# Requires: Ruby >= 2.7 (stdlib only: socket, optparse). Reads /proc, so the
# system-stat collectors below are Linux-specific; the HTTP server and
# metrics registry are portable to any OS (see the Windows note in
# Troubleshooting for how to swap in WMI-backed collectors there).
require 'socket'
require 'optparse'
# --- Metric registry --------------------------------------------------------
#
# A tiny stand-in for what `prometheus-client` gives you: named metrics with
# help text and a type, rendered in the Prometheus text exposition format.
# Real Prometheus metric types (counter, gauge) are represented here just
# well enough to be correct for scraping -- this is deliberately not a full
# client library.
class MetricsRegistry
  Metric = Struct.new(:name, :help, :type, :value_fn)
  def initialize
    @metrics = []
  end
  # Registers a gauge: a value that can go up or down (e.g. current memory
  # used). `value_fn` is called fresh on every scrape so the exporter always
  # reports live data, not a stale snapshot from startup.
  def gauge(name, help, &value_fn)
    @metrics << Metric.new(name, help, 'gauge', value_fn)
  end
  # Registers a counter: a value that only increases (e.g. total requests
  # served). Prometheus counters are rendered identically to gauges on the
  # wire -- the distinction is purely about how consumers should interpret
  # resets -- but we track the type for the HELP/TYPE header lines.
  def counter(name, help, &value_fn)
    @metrics << Metric.new(name, help, 'counter', value_fn)
  end
  # Renders every registered metric in the Prometheus text exposition
  # format: https://prometheus.io/docs/instrumenting/exposition_formats/
  def render
    lines = []
    @metrics.each do |m|
      value = m.value_fn.call
      next if value.nil? # collector unavailable on this platform -- skip silently
      lines << "# HELP #{m.name} #{m.help}"
      lines << "# TYPE #{m.name} #{m.type}"
      lines << "#{m.name} #{format_value(value)}"
    end
    "#{lines.join("\n")}\n"
  end
  private
  def format_value(v)
    v.is_a?(Float) ? format('%.4f', v) : v.to_s
  end
end
# --- /proc collectors (Linux) -----------------------------------------------
#
# Each method returns nil (rather than raising) when the expected /proc file
# isn't present, so the registry can skip that metric gracefully on
# non-Linux platforms instead of crashing the whole exporter.
module ProcStats
  module_function
  def load_average_1m
    File.read('/proc/loadavg').split(' ').first.to_f
  rescue Errno::ENOENT
    nil
  end
  def memory_total_bytes
    meminfo['MemTotal']
  end
  def memory_available_bytes
    meminfo['MemAvailable']
  end
  def uptime_seconds
    File.read('/proc/uptime').split(' ').first.to_f
  rescue Errno::ENOENT
    nil
  end
  def meminfo
    return {} unless File.exist?('/proc/meminfo')
    File.readlines('/proc/meminfo').each_with_object({}) do |line, acc|
      # Lines look like "MemTotal:       16384000 kB"
      key, rest = line.split(':', 2)
      next unless rest
      kb = rest.strip.split(' ').first.to_i
      acc[key] = kb * 1024 # normalize to bytes, Prometheus convention
    end
  end
end
# --- HTTP server -------------------------------------------------------------
#
# A deliberately tiny HTTP/1.1 server built directly on TCPServer. It only
# understands enough of HTTP to (a) read a request line, (b) drain any
# request headers, and (c) write a well-formed response -- exactly what a
# scrape endpoint needs and nothing more. Each connection is handled on its
# own thread so a slow/stalled scraper client can't block others.
class Exporter
  def initialize(registry, port:, request_counter: nil)
    @registry = registry
    @port = port
    @request_counter = request_counter
  end
  def start
    server = TCPServer.new(@port)
    puts "prometheus_exporter listening on :#{@port} (GET /metrics)"
    loop do
      client = server.accept
      Thread.new(client) { |c| handle(c) }
    end
  ensure
    server&.close
  end
  private
  def handle(client)
    request_line = client.gets
    return unless request_line
    # Drain headers until the blank line that ends an HTTP request; we
    # don't need their contents for this read-only endpoint.
    while (line = client.gets)
      break if line == "\r\n" || line == "\n"
    end
    method, path, = request_line.split(' ')
    if method == 'GET' && path == '/metrics'
      @request_counter&.call
      body = @registry.render
      respond(client, 200, 'OK', 'text/plain; version=0.0.4', body)
    else
      respond(client, 404, 'Not Found', 'text/plain', "not found: #{path}\n")
    end
  rescue StandardError => e
    warn "request error: #{e.message}"
  ensure
    client.close
  end
  def respond(client, code, reason, content_type, body)
    client.write("HTTP/1.1 #{code} #{reason}\r\n")
    client.write("Content-Type: #{content_type}\r\n")
    client.write("Content-Length: #{body.bytesize}\r\n")
    client.write("Connection: close\r\n\r\n")
    client.write(body)
  end
end
# --- CLI entry point ---------------------------------------------------------
if $PROGRAM_NAME == __FILE__
  options = { port: 9200 }
  OptionParser.new do |opts|
    opts.banner = 'Usage: prometheus_exporter.rb [options]'
    opts.on('--port N', Integer, 'Port to listen on (default 9200)') { |v| options[:port] = v }
  end.parse!
  registry = MetricsRegistry.new
  scrape_count = 0
  registry.gauge('node_load1', 'Load average over the last minute') { ProcStats.load_average_1m }
  registry.gauge('node_memory_total_bytes', 'Total physical memory in bytes') { ProcStats.memory_total_bytes }
  registry.gauge('node_memory_available_bytes', 'Available physical memory in bytes') { ProcStats.memory_available_bytes }
  registry.gauge('node_uptime_seconds', 'Seconds since boot') { ProcStats.uptime_seconds }
  registry.gauge('ruby_exporter_process_uptime_seconds', 'Seconds since this exporter process started') do
    (Process.clock_gettime(Process::CLOCK_MONOTONIC) - $exporter_start).round(4)
  end
  # Example custom counter: total number of times this exporter itself has
  # been scraped. This is the pattern you'd copy for an app-specific metric.
  registry.counter('ruby_exporter_scrapes_total', 'Total number of /metrics scrapes served') { scrape_count }
  $exporter_start = Process.clock_gettime(Process::CLOCK_MONOTONIC)
  exporter = Exporter.new(registry, port: options[:port], request_counter: -> { scrape_count += 1 })
  trap('INT') do
    puts "\nShutting down."
    exit
  end
  exporter.start
end
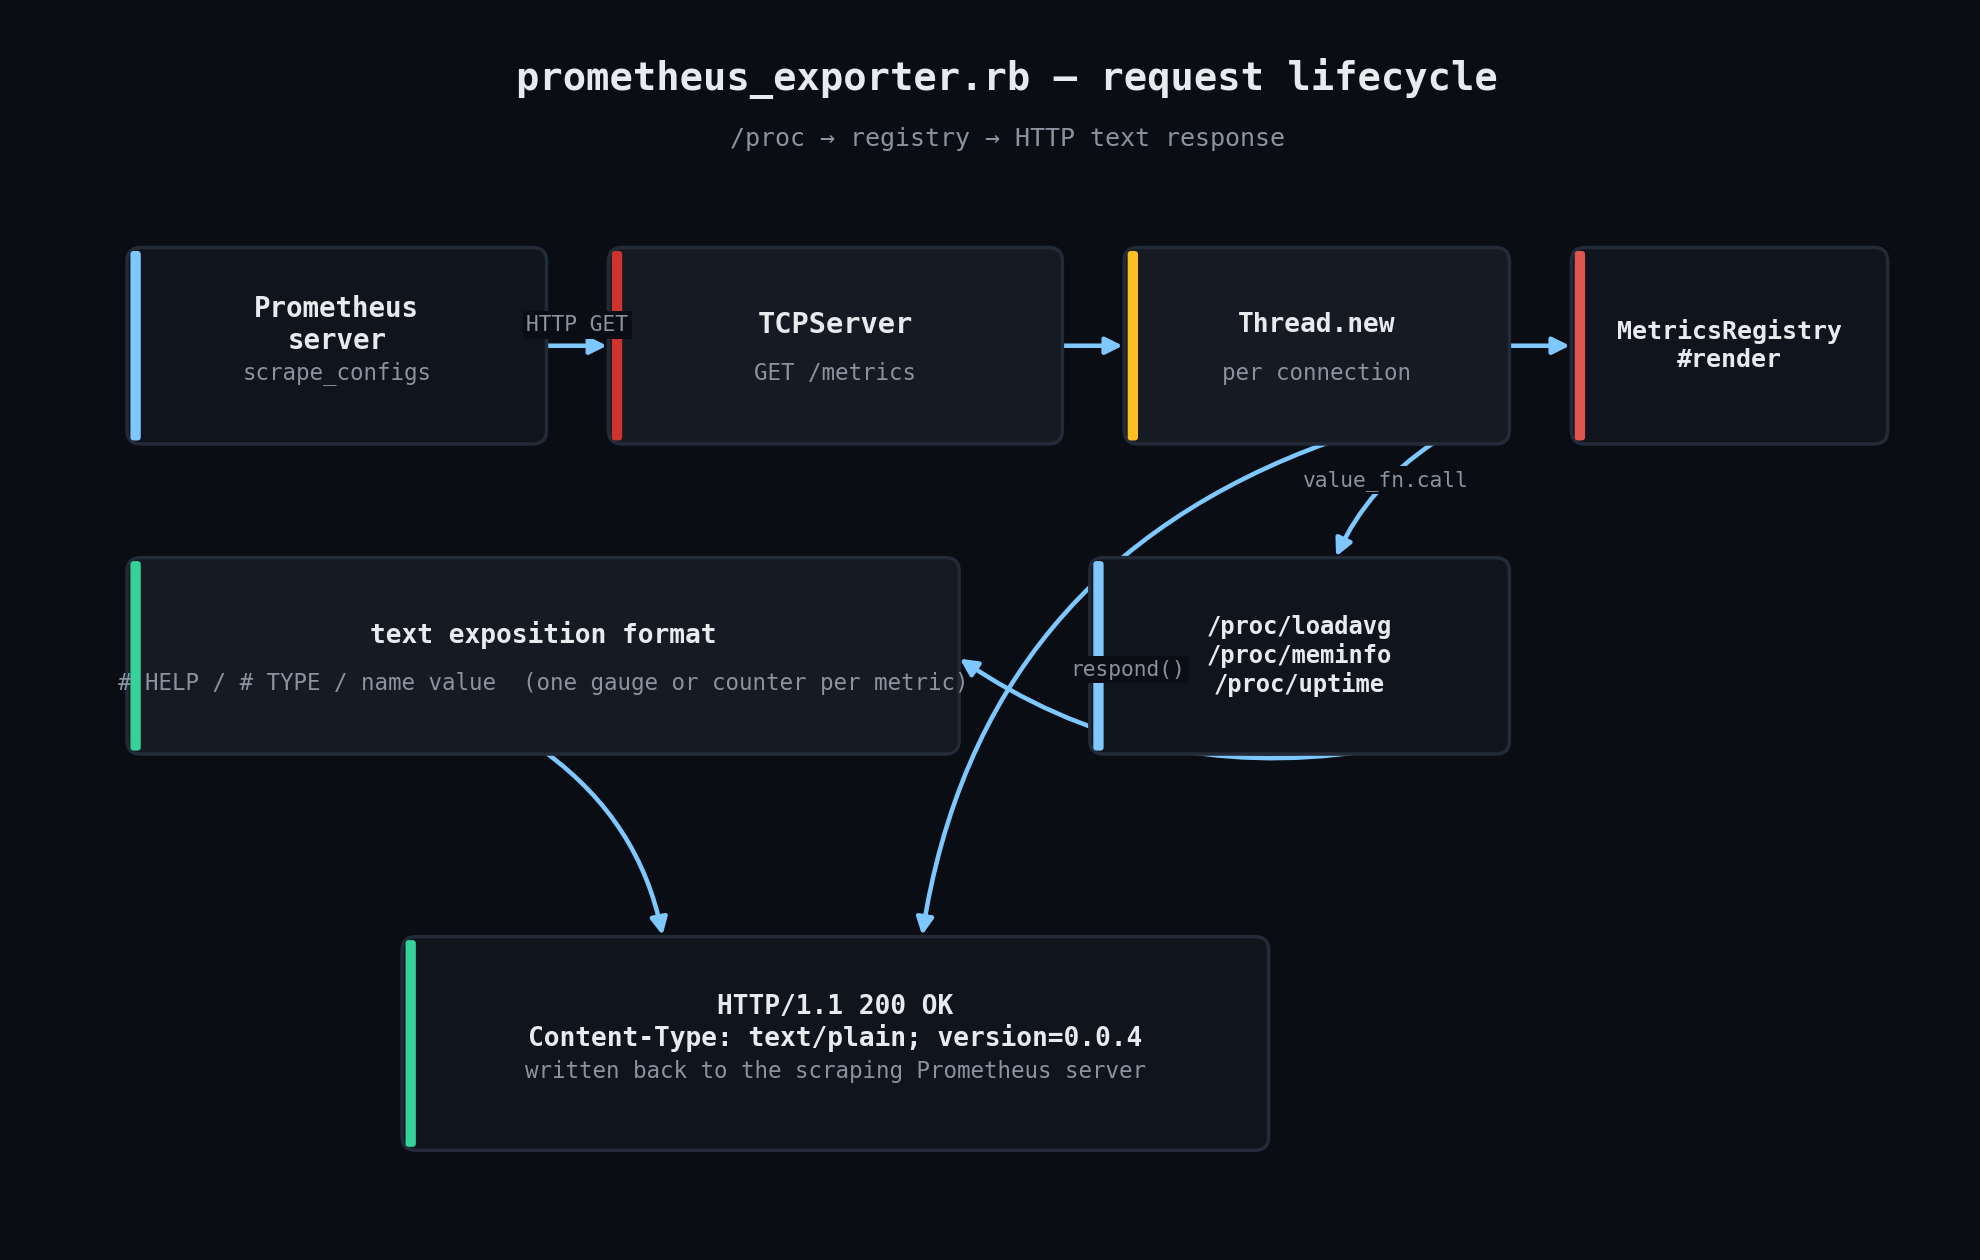
Step-by-step walkthrough
- Register —
registry.gauge(name, help) { block }andregistry.counter(...)attach a name, HELP text, a Prometheus type, and a lazily-evaluated value source. - Listen —
Exporter#startopens aTCPServeron the configured port and spawns a newThreadper accepted connection. - Parse — each handler reads the request line (
GET /metrics HTTP/1.1), drains headers up to the blank line, and checks the path. - Render — on a
/metricshit,MetricsRegistry#rendercalls every metric’s value block fresh and formats each as# HELP/# TYPE/name value, per the Prometheus text exposition format. - Respond — a minimal but correct HTTP/1.1 response is written back with
Content-Type: text/plain; version=0.0.4, exactly what Prometheus expects.
Example output
Started the exporter on a scratch port in the sandbox and scraped it twice with curl: the response was valid Prometheus text format both times, live system values (load average, memory, uptime) were present and changing between scrapes, and the ruby_exporter_scrapes_total counter correctly incremented from 1 to 2. A request to an unknown path correctly returned 404.
Troubleshooting
- Metrics show as missing/blank on non-Linux hosts — the bundled collectors read
/proc, which is Linux-specific. On macOS or Windows, swapProcStatsfor platform-appropriate sources (e.g.sysctlviaOpen3on macOS, or WMI viawin32oleon Windows, matching the pattern in this repo’s other Windows tutorials) — the registry and HTTP server don’t need to change at all. - “Address already in use” — another process (maybe a previous run of this script) is still bound to the port; pick a different
--portor stop the earlier process. - Prometheus shows the target as down — confirm the exporter is reachable from the Prometheus host specifically (firewall rules, container networking), not just from localhost.
Extending this script
- Add labels (e.g.
node_load1{host="web-1"}) by extendingMetricsRegistry#renderto accept a labels hash per metric. - Add a histogram or summary type for request-latency-style metrics, following the same text-format spec.
- Wrap your own application’s internal counters (queue depth, cache hit rate) as custom gauges/counters — this is the exact pattern to copy.
- Add basic auth or an allowlist check in
Exporter#handleif the exporter will be reachable outside a trusted network.