

“Too many open files” takes down busy services at 3 a.m. This script walks /proc and tells you which processes are about to hit their NOFILE ceiling, before they do.
Step through the build below:
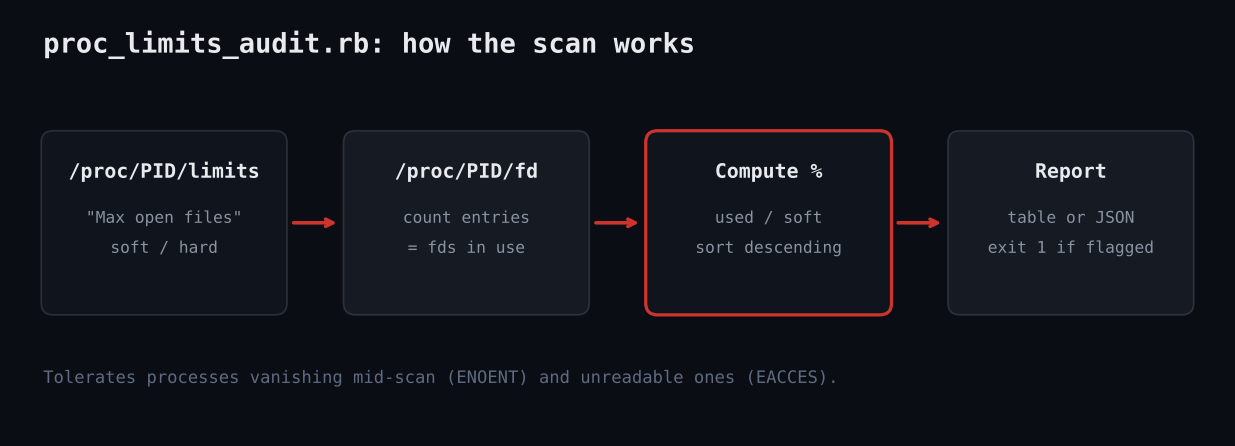
A web server, database or proxy that runs out of file descriptors starts refusing connections with EMFILE: Too many open files. The soft limit is per-process and often still the 1024 default. This script reads /proc/PID/limits and counts /proc/PID/fd for every process, then ranks them by how much of their limit they use.
#!/usr/bin/env ruby
# frozen_string_literal: true
# proc_limits_audit.rb - find processes close to their "Max open files" soft limit.
# Usage: ruby proc_limits_audit.rb [--threshold 80] [--proc /proc] [--json]
require 'optparse'
require 'json'
opts = { threshold: 80.0, proc: '/proc', json: false }
OptionParser.new do |o|
  o.banner = 'Usage: proc_limits_audit.rb [options]'
  o.on('--threshold PCT', Float, 'flag at or above this % of soft limit (default 80)') { |v| opts[:threshold] = v }
  o.on('--proc DIR', 'procfs root (default /proc; useful for tests)') { |v| opts[:proc] = v }
  o.on('--json', 'emit JSON instead of a table') { opts[:json] = true }
end.parse!
# Parse the "Max open files" line of /proc/PID/limits -> [soft, hard] (nil = unlimited)
def open_files_limit(path)
  File.foreach(path) do |line|
    next unless line.start_with?('Max open files')
    soft, hard = line.split[3, 2].map { |v| v == 'unlimited' ? nil : v.to_i }
    return [soft, hard]
  end
  nil
end
rows = []
Dir.children(opts[:proc]).grep(/\A\d+\z/).each do |pid|
  dir = File.join(opts[:proc], pid)
  begin
    soft, hard = open_files_limit(File.join(dir, 'limits'))
    next if soft.nil? # unlimited or missing: nothing to compare against
    used = Dir.children(File.join(dir, 'fd')).size
    name = File.read(File.join(dir, 'comm')).strip
    rows << { pid: pid.to_i, name: name, used: used, soft: soft, hard: hard,
              pct: (used * 100.0 / soft).round(1) }
  rescue Errno::ENOENT, Errno::ESRCH, Errno::EACCES
    next # process exited mid-scan, or not ours to read (run as root for full view)
  end
end
rows.sort_by! { |r| -r[:pct] }
flagged = rows.select { |r| r[:pct] >= opts[:threshold] }
if opts[:json]
  puts JSON.pretty_generate(scanned: rows.size, flagged: flagged)
else
  puts format('Scanned %d processes, %d at or above %.0f%% of soft NOFILE limit', rows.size, flagged.size, opts[:threshold])
  puts format('%-7s %-18s %7s %7s %6s', 'PID', 'NAME', 'USED', 'SOFT', 'PCT')
  (flagged.empty? ? rows.first(5) : flagged).each do |r|
    puts format('%-7d %-18s %7d %7d %5.1f%%', r[:pid], r[:name][0, 18], r[:used], r[:soft], r[:pct])
  end
end
exit(flagged.empty? ? 0 : 1) # non-zero exit lets cron/CI alert
1. Parse the “Max open files” line (soft/hard, “unlimited” becomes nil). 2. Count entries in the fd directory. 3. Compute percent used and sort. 4. Rescue ENOENT/EACCES so vanished or unreadable processes never crash the scan. 5. Exit 1 when anything crosses the threshold so cron or CI can alert.
Scanned 2 processes, 1 at or above 80% of soft NOFILE limit
PID     NAME                  USED    SOFT    PCT
100     nginx                  950    1024  92.8%
exit 1 (expected 1)
{
  "scanned": 2,
  "flagged": [
    {
      "pid": 100,
      "name": "nginx",
      "used": 950,
      "soft": 1024,
      "hard": 4096,
      "pct": 92.8
    }
  ]
Full script + README on GitHub: ruby-devops-toolkit/proc-limits-audit
Catch descriptor exhaustion early
File descriptor leaks are slow: a service opens sockets and never closes them, and for days nothing looks wrong. Then the count reaches the soft limit and every new connection fails. Monitoring tools often track system-wide file-nr, which hides the fact that one process is at 98% of its own limit.
This tutorial builds a small Ruby tool that audits every process on a Linux host. It uses only the standard library, runs in well under a second, prints a table or JSON, and returns a non-zero exit code when something is at risk.
- Linux with procfs mounted at
/proc - Ruby 2.7 or newer (tested on 3.3); no gems required
- Run as root to see every process; as a normal user you only see your own
Complete code
#!/usr/bin/env ruby
# frozen_string_literal: true
# proc_limits_audit.rb - find processes close to their "Max open files" soft limit.
# Usage: ruby proc_limits_audit.rb [--threshold 80] [--proc /proc] [--json]
require 'optparse'
require 'json'
opts = { threshold: 80.0, proc: '/proc', json: false }
OptionParser.new do |o|
  o.banner = 'Usage: proc_limits_audit.rb [options]'
  o.on('--threshold PCT', Float, 'flag at or above this % of soft limit (default 80)') { |v| opts[:threshold] = v }
  o.on('--proc DIR', 'procfs root (default /proc; useful for tests)') { |v| opts[:proc] = v }
  o.on('--json', 'emit JSON instead of a table') { opts[:json] = true }
end.parse!
# Parse the "Max open files" line of /proc/PID/limits -> [soft, hard] (nil = unlimited)
def open_files_limit(path)
  File.foreach(path) do |line|
    next unless line.start_with?('Max open files')
    soft, hard = line.split[3, 2].map { |v| v == 'unlimited' ? nil : v.to_i }
    return [soft, hard]
  end
  nil
end
rows = []
Dir.children(opts[:proc]).grep(/\A\d+\z/).each do |pid|
  dir = File.join(opts[:proc], pid)
  begin
    soft, hard = open_files_limit(File.join(dir, 'limits'))
    next if soft.nil? # unlimited or missing: nothing to compare against
    used = Dir.children(File.join(dir, 'fd')).size
    name = File.read(File.join(dir, 'comm')).strip
    rows << { pid: pid.to_i, name: name, used: used, soft: soft, hard: hard,
              pct: (used * 100.0 / soft).round(1) }
  rescue Errno::ENOENT, Errno::ESRCH, Errno::EACCES
    next # process exited mid-scan, or not ours to read (run as root for full view)
  end
end
rows.sort_by! { |r| -r[:pct] }
flagged = rows.select { |r| r[:pct] >= opts[:threshold] }
if opts[:json]
  puts JSON.pretty_generate(scanned: rows.size, flagged: flagged)
else
  puts format('Scanned %d processes, %d at or above %.0f%% of soft NOFILE limit', rows.size, flagged.size, opts[:threshold])
  puts format('%-7s %-18s %7s %7s %6s', 'PID', 'NAME', 'USED', 'SOFT', 'PCT')
  (flagged.empty? ? rows.first(5) : flagged).each do |r|
    puts format('%-7d %-18s %7d %7d %5.1f%%', r[:pid], r[:name][0, 18], r[:used], r[:soft], r[:pct])
  end
end
exit(flagged.empty? ? 0 : 1) # non-zero exit lets cron/CI alert
Step by step
Parse the limits file
open_files_limit scans /proc/PID/limits for the line starting with “Max open files” and splits it into soft and hard values. The word “unlimited” is mapped to nil so we skip those processes.
Count open descriptors
Every entry in /proc/PID/fd is one open descriptor, so Dir.children(...).size is the usage figure.
Tolerate races
Processes exit while we scan. We rescue ENOENT, ESRCH and EACCES and move on rather than failing the whole run.
Rank and report
Rows are sorted by percent used. Anything at or above --threshold (default 80) is flagged; otherwise the top five are shown for context.
Signal with the exit code
Exit 1 if anything was flagged, 0 otherwise, which makes the script drop-in for cron, systemd timers or CI checks.
What you should see
Scanned 2 processes, 1 at or above 80% of soft NOFILE limit
PID     NAME                  USED    SOFT    PCT
100     nginx                  950    1024  92.8%
exit 1 (expected 1)
{
  "scanned": 2,
  "flagged": [
    {
      "pid": 100,
      "name": "nginx",
      "used": 950,
      "soft": 1024,
      "hard": 4096,
      "pct": 92.8
    }
  ]
- Only a few processes scanned: run with sudo, otherwise other users’ fd directories raise EACCES and are skipped.
- Percentages look low but the service fails: the limit may be raised at runtime or set by systemd
LimitNOFILE=; compare againstsystemctl show. - On containers the /proc you see is the container’s; run on the host to audit all workloads.
- Tested here against a fake procfs and the live sandbox /proc.
- Add a
Max processescheck from the same limits file. - Push flagged rows to Slack or Prometheus (node_exporter textfile).
- Track growth over time to detect leaks, not just levels.
- Read
/proc/PID/cmdlinefor friendlier names.