

When a box gets slow, the first question is who is connected and in what state. This script answers it from /proc/net/tcp in pure Ruby: state counts, per-port hits, noisiest peers, and cron-friendly exit codes for TIME_WAIT pile-ups, SYN floods and socket leaks.
Full script + README on GitHub: ruby-devops-toolkit/tcp-conn-monitor
Step through the build below:
The symptom: the app is ‘up’ but requests hang. ss -s says 18,000 TIME_WAIT sockets, or 900 SYN_RECV, or one IP holds 1,200 connections. You want that number in a dashboard, a cron job, and a Nagios/Zabbix check — without shelling out to ss and regex-parsing its output on every host.
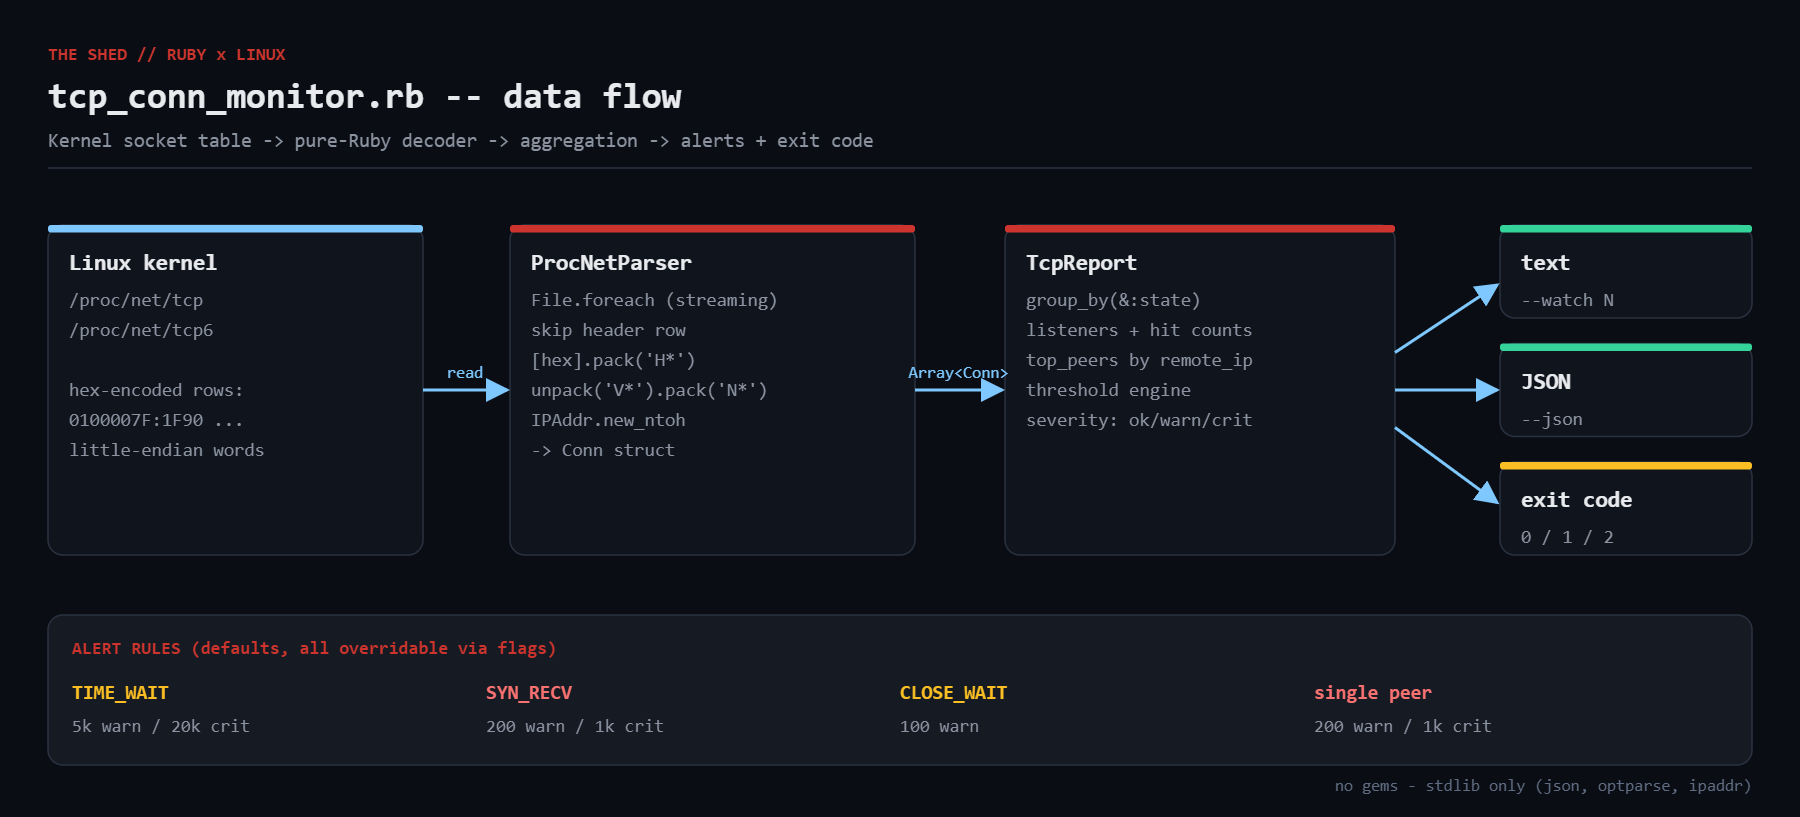
The approach: the kernel already publishes every socket in /proc/net/tcp and /proc/net/tcp6. The rows are hex, little-endian, and slightly hostile, but Ruby’s pack/unpack and IPAddr decode them in four lines. Everything else is group_by.
What you get: a state table, listening ports with live hit counts, top remote peers, threshold alerts with sane defaults, --json for machines, --watch for humans, and exit code 0/1/2.
#!/usr/bin/env ruby
# frozen_string_literal: true
#
# tcp_conn_monitor.rb -- TCP connection-state monitor for Linux, written in
# pure Ruby (no gems, no netstat/ss binaries required).
#
# It reads /proc/net/tcp and /proc/net/tcp6 directly, decodes the kernel's
# hex-encoded socket table, and reports:
#   * a count of every TCP state (ESTABLISHED, TIME_WAIT, SYN_RECV, ...)
#   * which local ports are listening, and how many connections each has
#   * the top remote peers by connection count (who is hammering us?)
#   * threshold alerts (too many TIME_WAIT, SYN flood signs, one noisy peer)
#
# Usage:
#   ruby tcp_conn_monitor.rb                 # human-readable report
#   ruby tcp_conn_monitor.rb --json          # machine-readable JSON
#   ruby tcp_conn_monitor.rb --top 5         # show top 5 peers/ports
#   ruby tcp_conn_monitor.rb --watch 10      # refresh every 10 seconds
#   ruby tcp_conn_monitor.rb --proc-dir DIR  # read fixtures instead of /proc
#
# Exit codes: 0 = healthy, 1 = warnings, 2 = critical (useful for cron/Nagios).
require 'json'
require 'optparse'
require 'ipaddr'
# Kernel socket-state codes from include/net/tcp_states.h
TCP_STATES = {
  '01' => 'ESTABLISHED', '02' => 'SYN_SENT',  '03' => 'SYN_RECV',
  '04' => 'FIN_WAIT1',   '05' => 'FIN_WAIT2', '06' => 'TIME_WAIT',
  '07' => 'CLOSE',       '08' => 'CLOSE_WAIT', '09' => 'LAST_ACK',
  '0A' => 'LISTEN',      '0B' => 'CLOSING',   '0C' => 'NEW_SYN_RECV'
}.freeze
# Tunable alert thresholds. Override with --warn-*/--crit-* flags if you like,
# or just edit these to taste for your workload.
DEFAULT_THRESHOLDS = {
  time_wait_warn: 5_000,   # lots of short-lived connections; consider reuse
  time_wait_crit: 20_000,  # ephemeral port exhaustion is near
  syn_recv_warn:  200,     # half-open backlog growing -> possible SYN flood
  syn_recv_crit:  1_000,
  peer_warn:      200,     # a single remote IP holding this many connections
  peer_crit:      1_000,
  close_wait_warn: 100     # app is not closing sockets it was handed (leak)
}.freeze
# One row from /proc/net/tcp{,6}. We keep only what we need.
Conn = Struct.new(:local_ip, :local_port, :remote_ip, :remote_port, :state, :uid, :inode)
class ProcNetParser
  def initialize(proc_dir: '/proc')
    @proc_dir = proc_dir
  end
  # Returns an Array<Conn> for both IPv4 and IPv6 tables.
  def connections
    conns = []
    %w[tcp tcp6].each do |table|
      path = File.join(@proc_dir, 'net', table)
      next unless File.readable?(path)
      File.foreach(path).with_index do |line, idx|
        next if idx.zero? # header row: "sl local_address rem_address st ..."
        conn = parse_line(line, table == 'tcp6')
        conns << conn if conn
      end
    end
    conns
  end
  private
  # Example /proc/net/tcp row (fields are whitespace separated):
  #   0: 0100007F:1F90 00000000:0000 0A 00000000:00000000 00:00000000 00000000  1000  0 12345 ...
  #      ^local       ^remote       ^state                                     ^uid    ^inode
  def parse_line(line, ipv6)
    f = line.split
    return nil if f.size < 10
    lip, lport = decode_addr(f[1], ipv6)
    rip, rport = decode_addr(f[2], ipv6)
    Conn.new(lip, lport, rip, rport, TCP_STATES.fetch(f[3], "UNKNOWN(#{f[3]})"), f[7].to_i, f[9].to_i)
  end
  # "0100007F:1F90" -> ["127.0.0.1", 8080]
  # The kernel writes IPv4 as a little-endian 32-bit hex word, and IPv6 as four
  # little-endian 32-bit words, so we have to byte-swap each 4-byte group.
  def decode_addr(field, ipv6)
    hex, port = field.split(':')
    bytes = [hex].pack('H*')                    # hex string -> raw bytes
    swapped = bytes.unpack('V*').pack('N*')     # LE words -> BE words
    ip = ipv6 ? IPAddr.new_ntoh(swapped) : IPAddr.new_ntoh(swapped[0, 4])
    ip = ip.ipv4_mapped? ? ip.native : ip if ipv6 # ::ffff:1.2.3.4 -> 1.2.3.4
    [ip.to_s, port.to_i(16)]
  end
end
class TcpReport
  attr_reader :conns, :thresholds
  def initialize(conns, thresholds: DEFAULT_THRESHOLDS, top: 10)
    @conns = conns
    @thresholds = thresholds
    @top = top
  end
  def state_counts
    conns.group_by(&:state).transform_values(&:size).sort_by { |_, v| -v }.to_h
  end
  # Listening sockets, plus how many non-LISTEN connections target each port.
  def listeners
    listen = conns.select { |c| c.state == 'LISTEN' }
    active = conns.reject { |c| c.state == 'LISTEN' }
    listen.map do |l|
      hits = active.count { |c| c.local_port == l.local_port }
      { port: l.local_port, bind: l.local_ip, uid: l.uid, connections: hits }
    end.uniq { |h| [h[:port], h[:bind]] }.sort_by { |h| -h[:connections] }
  end
  def top_peers
    conns.reject { |c| c.state == 'LISTEN' || c.remote_ip == '0.0.0.0' || c.remote_ip == '::' }
         .group_by(&:remote_ip)
         .map { |ip, list| { ip: ip, connections: list.size, states: list.group_by(&:state).transform_values(&:size) } }
         .sort_by { |h| -h[:connections] }
         .first(@top)
  end
  # Returns [severity_symbol, [messages]] where severity is :ok/:warn/:crit
  def alerts
    sc = state_counts
    msgs = []
    sev = :ok
    bump = ->(level) { sev = level if level == :crit || (level == :warn && sev == :ok) }
    tw = sc.fetch('TIME_WAIT', 0)
    if tw >= thresholds[:time_wait_crit]
      bump.(:crit); msgs << "CRIT TIME_WAIT=#{tw} (ephemeral port exhaustion likely)"
    elsif tw >= thresholds[:time_wait_warn]
      bump.(:warn); msgs << "WARN TIME_WAIT=#{tw} (consider keep-alive / net.ipv4.tcp_tw_reuse)"
    end
    sr = sc.fetch('SYN_RECV', 0)
    if sr >= thresholds[:syn_recv_crit]
      bump.(:crit); msgs << "CRIT SYN_RECV=#{sr} (SYN flood or overwhelmed accept queue)"
    elsif sr >= thresholds[:syn_recv_warn]
      bump.(:warn); msgs << "WARN SYN_RECV=#{sr} (half-open backlog growing)"
    end
    cw = sc.fetch('CLOSE_WAIT', 0)
    if cw >= thresholds[:close_wait_warn]
      bump.(:warn); msgs << "WARN CLOSE_WAIT=#{cw} (application is not closing sockets)"
    end
    top_peers.each do |p|
      if p[:connections] >= thresholds[:peer_crit]
        bump.(:crit); msgs << "CRIT peer #{p[:ip]} holds #{p[:connections]} connections"
      elsif p[:connections] >= thresholds[:peer_warn]
        bump.(:warn); msgs << "WARN peer #{p[:ip]} holds #{p[:connections]} connections"
      end
    end
    [sev, msgs]
  end
  def to_h
    sev, msgs = alerts
    {
      timestamp: Time.now.utc.iso8601,
      host: (File.read('/etc/hostname').strip rescue 'unknown'),
      total: conns.size,
      states: state_counts,
      listeners: listeners.first(@top),
      top_peers: top_peers,
      severity: sev,
      alerts: msgs
    }
  end
  def to_text
    h = to_h
    out = []
    out << "TCP connection report  #{h[:host]}  #{h[:timestamp]}"
    out << ('=' * 64)
    out << format('%-14s %6s', 'STATE', 'COUNT')
    h[:states].each { |s, n| out << format('%-14s %6d', s, n) }
    out << format('%-14s %6d', 'TOTAL', h[:total])
    out << ''
    out << format('%-6s %-24s %5s %6s', 'PORT', 'BIND', 'UID', 'CONNS')
    h[:listeners].each { |l| out << format('%-6d %-24s %5d %6d', l[:port], l[:bind], l[:uid], l[:connections]) }
    out << ''
    out << format('%-40s %6s  %s', 'REMOTE PEER', 'CONNS', 'STATES')
    h[:top_peers].each do |p|
      states = p[:states].map { |s, n| "#{s}=#{n}" }.join(' ')
      out << format('%-40s %6d  %s', p[:ip], p[:connections], states)
    end
    out << ''
    out << "severity: #{h[:severity].to_s.upcase}"
    h[:alerts].each { |m| out << "  #{m}" }
    out << '  no threshold breached' if h[:alerts].empty?
    out.join("\n")
  end
end
def exit_code_for(sev)
  { ok: 0, warn: 1, crit: 2 }.fetch(sev)
end
if __FILE__ == $PROGRAM_NAME
  require 'time'
  opts = { json: false, top: 10, watch: nil, proc_dir: '/proc' }
  thresholds = DEFAULT_THRESHOLDS.dup
  OptionParser.new do |o|
    o.banner = 'Usage: tcp_conn_monitor.rb [options]'
    o.on('--json', 'Emit JSON instead of text') { opts[:json] = true }
    o.on('--top N', Integer, 'Rows to show for ports/peers (default 10)') { |n| opts[:top] = n }
    o.on('--watch SEC', Integer, 'Re-run every SEC seconds') { |n| opts[:watch] = n }
    o.on('--proc-dir DIR', 'Alternate /proc root (for testing)') { |d| opts[:proc_dir] = d }
    thresholds.each_key do |k|
      o.on("--#{k.to_s.tr('_', '-')} N", Integer, "Threshold (default #{thresholds[k]})") { |n| thresholds[k] = n }
    end
  end.parse!
  last_severity = :ok
  loop do
    conns = ProcNetParser.new(proc_dir: opts[:proc_dir]).connections
    report = TcpReport.new(conns, thresholds: thresholds, top: opts[:top])
    last_severity = report.alerts.first
    if opts[:json]
      puts JSON.pretty_generate(report.to_h)
    else
      print "\e[2J\e[H" if opts[:watch] # clear screen in watch mode
      puts report.to_text
    end
    break unless opts[:watch]
    sleep opts[:watch]
  end
  exit exit_code_for(last_severity)
end
Decoding addresses. 0100007F:1F90 is 127.0.0.1:8080. The IPv4 word is little-endian, so [hex].pack('H*') turns the hex into raw bytes, unpack('V*').pack('N*') swaps every 4-byte word to network order, and IPAddr.new_ntoh builds the address. The same trick works for IPv6 because the kernel writes it as four little-endian 32-bit words.
Fixture support. --proc-dir points the parser at any directory containing net/tcp. That is how the output tab was produced: a synthetic table with 6,200 TIME_WAIT rows and a chatty peer, so every alert path is exercised without needing a real incident.
Severity, not just numbers. TcpReport#alerts walks the thresholds and bumps severity from :ok to :warn to :crit. The exit code maps directly onto that, so cron + MAILTO, systemd timers, or any monitoring agent can use it unchanged.
$ ruby tcp_conn_monitor.rb --proc-dir /tmp/fakeproc --top 5
TCP connection report  claude  2026-09-09T14:49:52Z
================================================================
STATE           COUNT
TIME_WAIT        6200
ESTABLISHED       344
SYN_RECV          250
CLOSE_WAIT        120
LISTEN              4
TOTAL            6918
PORT   BIND                       UID  CONNS
443    0.0.0.0                     33   6790
5432   127.0.0.1                  105    120
22     0.0.0.0                      0      3
80     ::                           0      1
REMOTE PEER                               CONNS  STATES
198.51.100.7                                340  ESTABLISHED=340
203.0.113.24                                176  TIME_WAIT=176
203.0.113.11                                175  TIME_WAIT=175
203.0.113.26                                173  TIME_WAIT=173
203.0.113.34                                172  TIME_WAIT=172
severity: WARN
  WARN TIME_WAIT=6200 (consider keep-alive / net.ipv4.tcp_tw_reuse)
  WARN SYN_RECV=250 (half-open backlog growing)
  WARN CLOSE_WAIT=120 (application is not closing sockets)
  WARN peer 198.51.100.7 holds 340 connections
$ echo exit=$?
exit=1
The problem this solves
Every Linux engineer has typed ss -tan | awk '{print $1}' | sort | uniq -c during an incident. It works, but it is a one-off. The moment you want the same view on 40 hosts, on a schedule, with alert thresholds and structured output, a shell pipeline becomes brittle: ss output columns differ between iproute2 versions, netstat is deprecated, and neither is installed in slim containers.
The kernel’s own view of the socket table lives in /proc/net/tcp (IPv4) and /proc/net/tcp6. It is a plain text file, readable by any user, present on every Linux since 2.x, and it needs no binaries at all. The only cost is that the format was designed for C, not humans: addresses are hex and byte-swapped, ports are hex, and the state is a two-digit code. This tutorial builds a small, dependency-free Ruby tool that decodes that table and turns it into something you can actually alert on.
The three failure modes it is tuned for are the ones that bite most often: TIME_WAIT exhaustion (short-lived outbound connections eating the ephemeral port range), SYN_RECV growth (a SYN flood or an overwhelmed accept queue), and CLOSE_WAIT leaks (the application was handed a closed socket and never called close). A fourth rule flags any single remote IP holding an unreasonable number of connections.
Prerequisites
- Ruby 2.7+ (tested on 3.0.2). Only stdlib:
json,optparse,ipaddr,time. - Linux with
/procmounted (any distro, containers included). Reading/proc/net/tcpdoes not require root; theuidcolumn is still populated for other users’ sockets. - For the
--watchmode, a terminal that understands ANSI clear-screen escapes (any modern one).
The complete script
Reference copy of the whole script (the widget above has the same code with a copy button).
#!/usr/bin/env ruby
# frozen_string_literal: true
#
# tcp_conn_monitor.rb -- TCP connection-state monitor for Linux, written in
# pure Ruby (no gems, no netstat/ss binaries required).
#
# It reads /proc/net/tcp and /proc/net/tcp6 directly, decodes the kernel's
# hex-encoded socket table, and reports:
#   * a count of every TCP state (ESTABLISHED, TIME_WAIT, SYN_RECV, ...)
#   * which local ports are listening, and how many connections each has
#   * the top remote peers by connection count (who is hammering us?)
#   * threshold alerts (too many TIME_WAIT, SYN flood signs, one noisy peer)
#
# Usage:
#   ruby tcp_conn_monitor.rb                 # human-readable report
#   ruby tcp_conn_monitor.rb --json          # machine-readable JSON
#   ruby tcp_conn_monitor.rb --top 5         # show top 5 peers/ports
#   ruby tcp_conn_monitor.rb --watch 10      # refresh every 10 seconds
#   ruby tcp_conn_monitor.rb --proc-dir DIR  # read fixtures instead of /proc
#
# Exit codes: 0 = healthy, 1 = warnings, 2 = critical (useful for cron/Nagios).
require 'json'
require 'optparse'
require 'ipaddr'
# Kernel socket-state codes from include/net/tcp_states.h
TCP_STATES = {
  '01' => 'ESTABLISHED', '02' => 'SYN_SENT',  '03' => 'SYN_RECV',
  '04' => 'FIN_WAIT1',   '05' => 'FIN_WAIT2', '06' => 'TIME_WAIT',
  '07' => 'CLOSE',       '08' => 'CLOSE_WAIT', '09' => 'LAST_ACK',
  '0A' => 'LISTEN',      '0B' => 'CLOSING',   '0C' => 'NEW_SYN_RECV'
}.freeze
# Tunable alert thresholds. Override with --warn-*/--crit-* flags if you like,
# or just edit these to taste for your workload.
DEFAULT_THRESHOLDS = {
  time_wait_warn: 5_000,   # lots of short-lived connections; consider reuse
  time_wait_crit: 20_000,  # ephemeral port exhaustion is near
  syn_recv_warn:  200,     # half-open backlog growing -> possible SYN flood
  syn_recv_crit:  1_000,
  peer_warn:      200,     # a single remote IP holding this many connections
  peer_crit:      1_000,
  close_wait_warn: 100     # app is not closing sockets it was handed (leak)
}.freeze
# One row from /proc/net/tcp{,6}. We keep only what we need.
Conn = Struct.new(:local_ip, :local_port, :remote_ip, :remote_port, :state, :uid, :inode)
class ProcNetParser
  def initialize(proc_dir: '/proc')
    @proc_dir = proc_dir
  end
  # Returns an Array<Conn> for both IPv4 and IPv6 tables.
  def connections
    conns = []
    %w[tcp tcp6].each do |table|
      path = File.join(@proc_dir, 'net', table)
      next unless File.readable?(path)
      File.foreach(path).with_index do |line, idx|
        next if idx.zero? # header row: "sl local_address rem_address st ..."
        conn = parse_line(line, table == 'tcp6')
        conns << conn if conn
      end
    end
    conns
  end
  private
  # Example /proc/net/tcp row (fields are whitespace separated):
  #   0: 0100007F:1F90 00000000:0000 0A 00000000:00000000 00:00000000 00000000  1000  0 12345 ...
  #      ^local       ^remote       ^state                                     ^uid    ^inode
  def parse_line(line, ipv6)
    f = line.split
    return nil if f.size < 10
    lip, lport = decode_addr(f[1], ipv6)
    rip, rport = decode_addr(f[2], ipv6)
    Conn.new(lip, lport, rip, rport, TCP_STATES.fetch(f[3], "UNKNOWN(#{f[3]})"), f[7].to_i, f[9].to_i)
  end
  # "0100007F:1F90" -> ["127.0.0.1", 8080]
  # The kernel writes IPv4 as a little-endian 32-bit hex word, and IPv6 as four
  # little-endian 32-bit words, so we have to byte-swap each 4-byte group.
  def decode_addr(field, ipv6)
    hex, port = field.split(':')
    bytes = [hex].pack('H*')                    # hex string -> raw bytes
    swapped = bytes.unpack('V*').pack('N*')     # LE words -> BE words
    ip = ipv6 ? IPAddr.new_ntoh(swapped) : IPAddr.new_ntoh(swapped[0, 4])
    ip = ip.ipv4_mapped? ? ip.native : ip if ipv6 # ::ffff:1.2.3.4 -> 1.2.3.4
    [ip.to_s, port.to_i(16)]
  end
end
class TcpReport
  attr_reader :conns, :thresholds
  def initialize(conns, thresholds: DEFAULT_THRESHOLDS, top: 10)
    @conns = conns
    @thresholds = thresholds
    @top = top
  end
  def state_counts
    conns.group_by(&:state).transform_values(&:size).sort_by { |_, v| -v }.to_h
  end
  # Listening sockets, plus how many non-LISTEN connections target each port.
  def listeners
    listen = conns.select { |c| c.state == 'LISTEN' }
    active = conns.reject { |c| c.state == 'LISTEN' }
    listen.map do |l|
      hits = active.count { |c| c.local_port == l.local_port }
      { port: l.local_port, bind: l.local_ip, uid: l.uid, connections: hits }
    end.uniq { |h| [h[:port], h[:bind]] }.sort_by { |h| -h[:connections] }
  end
  def top_peers
    conns.reject { |c| c.state == 'LISTEN' || c.remote_ip == '0.0.0.0' || c.remote_ip == '::' }
         .group_by(&:remote_ip)
         .map { |ip, list| { ip: ip, connections: list.size, states: list.group_by(&:state).transform_values(&:size) } }
         .sort_by { |h| -h[:connections] }
         .first(@top)
  end
  # Returns [severity_symbol, [messages]] where severity is :ok/:warn/:crit
  def alerts
    sc = state_counts
    msgs = []
    sev = :ok
    bump = ->(level) { sev = level if level == :crit || (level == :warn && sev == :ok) }
    tw = sc.fetch('TIME_WAIT', 0)
    if tw >= thresholds[:time_wait_crit]
      bump.(:crit); msgs << "CRIT TIME_WAIT=#{tw} (ephemeral port exhaustion likely)"
    elsif tw >= thresholds[:time_wait_warn]
      bump.(:warn); msgs << "WARN TIME_WAIT=#{tw} (consider keep-alive / net.ipv4.tcp_tw_reuse)"
    end
    sr = sc.fetch('SYN_RECV', 0)
    if sr >= thresholds[:syn_recv_crit]
      bump.(:crit); msgs << "CRIT SYN_RECV=#{sr} (SYN flood or overwhelmed accept queue)"
    elsif sr >= thresholds[:syn_recv_warn]
      bump.(:warn); msgs << "WARN SYN_RECV=#{sr} (half-open backlog growing)"
    end
    cw = sc.fetch('CLOSE_WAIT', 0)
    if cw >= thresholds[:close_wait_warn]
      bump.(:warn); msgs << "WARN CLOSE_WAIT=#{cw} (application is not closing sockets)"
    end
    top_peers.each do |p|
      if p[:connections] >= thresholds[:peer_crit]
        bump.(:crit); msgs << "CRIT peer #{p[:ip]} holds #{p[:connections]} connections"
      elsif p[:connections] >= thresholds[:peer_warn]
        bump.(:warn); msgs << "WARN peer #{p[:ip]} holds #{p[:connections]} connections"
      end
    end
    [sev, msgs]
  end
  def to_h
    sev, msgs = alerts
    {
      timestamp: Time.now.utc.iso8601,
      host: (File.read('/etc/hostname').strip rescue 'unknown'),
      total: conns.size,
      states: state_counts,
      listeners: listeners.first(@top),
      top_peers: top_peers,
      severity: sev,
      alerts: msgs
    }
  end
  def to_text
    h = to_h
    out = []
    out << "TCP connection report  #{h[:host]}  #{h[:timestamp]}"
    out << ('=' * 64)
    out << format('%-14s %6s', 'STATE', 'COUNT')
    h[:states].each { |s, n| out << format('%-14s %6d', s, n) }
    out << format('%-14s %6d', 'TOTAL', h[:total])
    out << ''
    out << format('%-6s %-24s %5s %6s', 'PORT', 'BIND', 'UID', 'CONNS')
    h[:listeners].each { |l| out << format('%-6d %-24s %5d %6d', l[:port], l[:bind], l[:uid], l[:connections]) }
    out << ''
    out << format('%-40s %6s  %s', 'REMOTE PEER', 'CONNS', 'STATES')
    h[:top_peers].each do |p|
      states = p[:states].map { |s, n| "#{s}=#{n}" }.join(' ')
      out << format('%-40s %6d  %s', p[:ip], p[:connections], states)
    end
    out << ''
    out << "severity: #{h[:severity].to_s.upcase}"
    h[:alerts].each { |m| out << "  #{m}" }
    out << '  no threshold breached' if h[:alerts].empty?
    out.join("\n")
  end
end
def exit_code_for(sev)
  { ok: 0, warn: 1, crit: 2 }.fetch(sev)
end
if __FILE__ == $PROGRAM_NAME
  require 'time'
  opts = { json: false, top: 10, watch: nil, proc_dir: '/proc' }
  thresholds = DEFAULT_THRESHOLDS.dup
  OptionParser.new do |o|
    o.banner = 'Usage: tcp_conn_monitor.rb [options]'
    o.on('--json', 'Emit JSON instead of text') { opts[:json] = true }
    o.on('--top N', Integer, 'Rows to show for ports/peers (default 10)') { |n| opts[:top] = n }
    o.on('--watch SEC', Integer, 'Re-run every SEC seconds') { |n| opts[:watch] = n }
    o.on('--proc-dir DIR', 'Alternate /proc root (for testing)') { |d| opts[:proc_dir] = d }
    thresholds.each_key do |k|
      o.on("--#{k.to_s.tr('_', '-')} N", Integer, "Threshold (default #{thresholds[k]})") { |n| thresholds[k] = n }
    end
  end.parse!
  last_severity = :ok
  loop do
    conns = ProcNetParser.new(proc_dir: opts[:proc_dir]).connections
    report = TcpReport.new(conns, thresholds: thresholds, top: opts[:top])
    last_severity = report.alerts.first
    if opts[:json]
      puts JSON.pretty_generate(report.to_h)
    else
      print "\e[2J\e[H" if opts[:watch] # clear screen in watch mode
      puts report.to_text
    end
    break unless opts[:watch]
    sleep opts[:watch]
  end
  exit exit_code_for(last_severity)
end
How it works, step by step
Reading the kernel table with File.foreach
ProcNetParser#connections loops over both files. File.foreach streams line by line instead of slurping the file, which matters on a busy proxy where the table can be hundreds of thousands of rows. The first line is a header, so with_index lets us skip idx.zero?. Missing tcp6 (IPv6 disabled) is handled by the File.readable? guard.
Decoding a row
A row looks like 0: 0100007F:1F90 00000000:0000 0A ... 1000 0 12345. Field 1 is local address:port, field 2 is remote, field 3 is the state code, field 7 the owning UID and field 9 the socket inode. decode_addr does the heavy lifting: [hex].pack('H*') converts the hex text into bytes, then unpack('V*') reads them as little-endian 32-bit words and pack('N*') re-emits them big-endian, which is what IPAddr.new_ntoh expects. IPv4-mapped IPv6 addresses (::ffff:1.2.3.4) are collapsed back to plain IPv4 with native so the peer table does not split one client into two rows.
Aggregating with group_by
TcpReport never loops by hand. state_counts is group_by(&:state) followed by transform_values(&:size). listeners takes every LISTEN row and counts non-LISTEN rows on the same local port, which gives you ‘port 443 has 6,790 live connections’ at a glance. top_peers groups by remote IP and nests a per-state breakdown, so you can tell a legitimate keep-alive client (all ESTABLISHED) from a scanner (all SYN_RECV).
Thresholds and severity
DEFAULT_THRESHOLDS holds the numbers; every key is automatically exposed as a CLI flag (--time-wait-warn 8000) by the loop in the option parser. alerts uses a tiny bump lambda so a WARN can never downgrade a CRIT. The result is a [severity, messages] pair, which both the text/JSON renderers and the exit code consume.
Output modes
Text mode prints three aligned tables using format. JSON mode emits the same hash via JSON.pretty_generate, with an ISO-8601 timestamp and hostname so you can ship it straight to Elasticsearch or Loki. --watch N wraps the whole thing in a loop with a clear-screen escape, giving you a top-like live view. In every mode the process exits 0/1/2 from the last sample.
Example output
The run below points --proc-dir at a synthetic /proc containing 6,200 TIME_WAIT sockets, a 340-connection peer, a SYN_RECV spike and a CLOSE_WAIT leak, so every alert branch fires. Against the real sandbox /proc the same command reports two LISTEN sockets and severity OK with exit 0.
When it does not behave
- Every address decodes as
0.0.0.0or garbage. You are almost certainly on a big-endian host (rare: some MIPS/PowerPC appliances). Swapunpack('V*')forunpack('N*')— or skip the swap entirely. /proc/net/tcp6missing. IPv6 is disabled (ipv6.disable=1) or the container’s network namespace has no v6. The script skips it silently; nothing to fix.- Counts are lower than
ss -s.ssalso counts UDP, RAW and UNIX sockets in its summary line. Compare againstss -tan | wc -linstead. - Inside a container the table looks empty.
/proc/netis per network namespace. You are seeing the container’s own sockets, which is correct; run the script on the host (or with--net=host) to see everything. - Huge tables are slow. Above ~500k rows the Ruby object per row starts to matter. Stream and count states in one pass instead of building
Connstructs, or reduce--top.
Where to take it next
- Resolve the
inodecolumn to a PID by scanning/proc/*/fdsymlinks (socket:[12345]) so each listener shows the owning process name. - Add a
--prometheusflag that printstcp_connections{state="TIME_WAIT"} 6200lines for the node_exporter textfile collector. - Diff two samples to compute connection churn per second — new sockets minus closed — which is the real early-warning signal for port exhaustion.
- Enrich
top_peerswith reverse DNS or a GeoIP lookup, cached in a small JSON file to avoid hammering resolvers. - Ship JSON to a webhook (Slack, Teams, PagerDuty Events v2) whenever severity crosses from ok to crit.