

“90% memory used” means nothing on its own — the kernel happily eats spare RAM for page cache and hands it right back under pressure. This script combines MemAvailable, swap, kernel Pressure Stall Information (PSI), and an OOM-killer scan into one WARN/CRIT report that actually predicts trouble instead of just describing a number.
Step through the build below: the problem, the full script, how it works, and real output from both a healthy box and a simulated CRIT scenario.
free -h gives you a number, and that number is frequently a lie about how much trouble you’re in. A healthy box can sit at 90% memory “used” indefinitely — the kernel deliberately spends spare RAM on page cache and reclaims it instantly when something else needs it. A monitoring check built only on “percent used” pages you constantly for a perfectly fine box, and stays silent on a box that’s one allocation away from an OOM kill.
What actually predicts trouble is MemAvailable (which already accounts for reclaimable cache), whether the box is actively swapping, whether the kernel scheduler is stalling tasks waiting on memory (PSI — Pressure Stall Information), and whether the OOM killer has already fired. This script pulls all four signals into one report so it can drop into cron or an alerting pipeline instead of a human squinting at free.
#!/usr/bin/env ruby# frozen_string_literal: true## mem_pressure_monitor.rb -- Memory & swap pressure monitor for Linux.## `free -h` tells you a number. It does not tell you whether that number is# actually a problem right now. A box can sit at 90% memory "used" forever# because the kernel is using the rest for page cache -- totally fine. The# thing that actually predicts an OOM kill or a latency cliff is: is memory# genuinely SCARCE (MemAvailable, which already accounts for reclaimable# cache), is the box actively swapping, is the kernel scheduler stalling# tasks waiting on memory (PSI), and has the OOM killer already fired.# This script pulls all four signals into one WARN/CRIT report so it can# drop into cron or an alerting pipeline instead of a human staring at `free`.## No gems required -- everything here is Ruby stdlib.## Usage:# ruby mem_pressure_monitor.rb [options]## Examples:# ruby mem_pressure_monitor.rb# ruby mem_pressure_monitor.rb --json# ruby mem_pressure_monitor.rb --mem-warn 20 --mem-crit 8 --swap-crit 80## Exit codes (cron/CI friendly):# 0 - OK# 1 - WARN (memory or swap pressure building)# 2 - CRIT (memory critically low, heavy swapping, PSI saturated, or a# recent OOM kill was found)require 'optparse'require 'json'require 'open3'options = { mem_warn_pct: 15, # WARN if MemAvailable < 15% of MemTotal mem_crit_pct: 5, # CRIT if MemAvailable < 5% swap_warn_pct: 50, # WARN if swap used > 50% of SwapTotal swap_crit_pct: 90, # CRIT if swap used > 90% psi_warn: 10.0, # WARN if PSI "some avg60" > 10% psi_crit: 30.0, # CRIT if PSI "some avg60" > 30% oom_lookback_min: 60, json: false, meminfo_path: '/proc/meminfo', psi_path: '/proc/pressure/memory'}OptionParser.new do |opts| opts.banner = 'Usage: mem_pressure_monitor.rb [options]' opts.on('--mem-warn PCT', Float, 'MemAvailable %% WARN threshold (default 15)') { |v| options[:mem_warn_pct] = v } opts.on('--mem-crit PCT', Float, 'MemAvailable %% CRIT threshold (default 5)') { |v| options[:mem_crit_pct] = v } opts.on('--swap-warn PCT', Float, 'Swap-used %% WARN threshold (default 50)') { |v| options[:swap_warn_pct] = v } opts.on('--swap-crit PCT', Float, 'Swap-used %% CRIT threshold (default 90)') { |v| options[:swap_crit_pct] = v } opts.on('--psi-warn PCT', Float, 'PSI "some avg60" %% WARN threshold (default 10)') { |v| options[:psi_warn] = v } opts.on('--psi-crit PCT', Float, 'PSI "some avg60" %% CRIT threshold (default 30)') { |v| options[:psi_crit] = v } opts.on('--oom-lookback MIN', Integer, 'Minutes of journal/dmesg history to scan for OOM kills (default 60)') { |v| options[:oom_lookback_min] = v } opts.on('--meminfo-path PATH', String, 'Path to meminfo file (default /proc/meminfo; useful in containers with /host/proc mounted, and for testing)') { |v| options[:meminfo_path] = v } opts.on('--psi-path PATH', String, 'Path to PSI memory file (default /proc/pressure/memory)') { |v| options[:psi_path] = v } opts.on('--json', 'Emit machine-readable JSON instead of text') { options[:json] = true } opts.on('-h', '--help', 'Show this help') { puts opts; exit 0 }end.parse!SEVERITY_RANK = { ok: 0, warn: 1, crit: 2, unknown: 0 }.freezedef worse(a, b) SEVERITY_RANK[a] >= SEVERITY_RANK[b] ? a : bend# ---------------------------------------------------------------------------# /proc/meminfo# ---------------------------------------------------------------------------def read_meminfo(path = '/proc/meminfo') fields = {} File.foreach(path) do |line| # Lines look like: "MemTotal: 4009408 kB" if line =~ /^(\w+):\s+(\d+)(?:\s+(\w+))?/ fields[Regexp.last_match(1)] = Regexp.last_match(2).to_i end end fieldsenddef analyze_memory(meminfo, warn_pct, crit_pct) total = meminfo['MemTotal'].to_f available = meminfo['MemAvailable'].to_f return { status: :unknown, error: 'MemTotal missing from /proc/meminfo' } if total.zero? available_pct = (available / total * 100).round(1) status = if available_pct <= crit_pct :crit elsif available_pct <= warn_pct :warn else :ok end { status: status, total_mb: (total / 1024).round, available_mb: (available / 1024).round, available_pct: available_pct, used_pct: (100 - available_pct).round(1) }enddef analyze_swap(meminfo, warn_pct, crit_pct) total = meminfo['SwapTotal'].to_f free = meminfo['SwapFree'].to_f return { status: :ok, total_mb: 0, used_mb: 0, used_pct: 0.0, note: 'no swap configured' } if total.zero? used = total - free used_pct = (used / total * 100).round(1) status = if used_pct >= crit_pct :crit elsif used_pct >= warn_pct :warn else :ok end { status: status, total_mb: (total / 1024).round, used_mb: (used / 1024).round, used_pct: used_pct }end# ---------------------------------------------------------------------------# /proc/pressure/memory (PSI -- Pressure Stall Information, Linux 4.20+)# ---------------------------------------------------------------------------def read_psi(path = '/proc/pressure/memory') return nil unless File.readable?(path) lines = File.read(path) parsed = {} lines.each_line do |line| kind = line[/^(some|full)/, 1] next unless kind values = {} line.scan(/(\w+)=([\d.]+)/) { |k, v| values[k] = v.to_f } parsed[kind] = values end parsedrescue Errno::ENOENT, Errno::EACCES nilenddef analyze_psi(psi, warn_pct, crit_pct) return { status: :unknown, note: 'PSI not available on this kernel/cgroup (needs Linux 4.20+, CONFIG_PSI=y)' } if psi.nil? || psi.empty? some_avg60 = psi.dig('some', 'avg60') || 0.0 status = if some_avg60 >= crit_pct :crit elsif some_avg60 >= warn_pct :warn else :ok end { status: status, some_avg10: psi.dig('some', 'avg10'), some_avg60: some_avg60, some_avg300: psi.dig('some', 'avg300') }end# ---------------------------------------------------------------------------# OOM killer detection -- try journalctl first, fall back to dmesg. Both can# legitimately be unavailable (no systemd, no CAP_SYSLOG) -- that's reported# as :unknown, not treated as a hard failure.# ---------------------------------------------------------------------------def scan_for_oom(lookback_min) patterns = [/Out of memory/i, /oom[-_ ]kill/i, /Killed process/i] out, status = try_journalctl(lookback_min) source = 'journalctl' if status.nil? || !status.success? out, status = try_dmesg source = 'dmesg' end return { status: :unknown, note: 'neither journalctl nor dmesg were readable in this environment (needs root/CAP_SYSLOG)' } if status.nil? || !status.success? hits = out.lines.select { |l| patterns.any? { |p| l =~ p } } { status: hits.empty? ? :ok : :crit, source: source, oom_events_found: hits.size, sample: hits.first(3).map(&:strip) }enddef try_journalctl(lookback_min) # capture3 so journalctl's permission-hint noise on stderr doesn't leak # onto our stdout report -- we only care whether it actually worked. out, _err, status = Open3.capture3('journalctl', '-k', "--since=-#{lookback_min}min", '--no-pager', '-q') [out, status]rescue Errno::ENOENT, Errno::EACCES [nil, nil]enddef try_dmesg out, _err, status = Open3.capture3('dmesg') [out, status]rescue Errno::ENOENT, Errno::EACCES [nil, nil]end# ---------------------------------------------------------------------------# Run# ---------------------------------------------------------------------------meminfo = read_meminfo(options[:meminfo_path])mem = analyze_memory(meminfo, options[:mem_warn_pct], options[:mem_crit_pct])swap = analyze_swap(meminfo, options[:swap_warn_pct], options[:swap_crit_pct])psi = analyze_psi(read_psi(options[:psi_path]), options[:psi_warn], options[:psi_crit])oom = scan_for_oom(options[:oom_lookback_min])overall = [mem[:status], swap[:status], psi[:status], oom[:status]].reduce(:ok) { |acc, s| worse(acc, s || :ok) }exit_code = { ok: 0, unknown: 0, warn: 1, crit: 2 }[overall]if options[:json] puts JSON.pretty_generate(memory: mem, swap: swap, psi: psi, oom: oom, overall: overall, exit_code: exit_code)else fmt = ->(s) { s.to_s.upcase.rjust(5) } puts "mem-pressure-monitor: #{Time.now}" puts puts "[#{fmt.call(mem[:status])}] memory available: #{mem[:available_mb]} MB / #{mem[:total_mb]} MB (#{mem[:available_pct]}% free, #{mem[:used_pct]}% used)" if swap[:total_mb].zero? puts "[#{fmt.call(swap[:status])}] swap: not configured" else puts "[#{fmt.call(swap[:status])}] swap used: #{swap[:used_mb]} MB / #{swap[:total_mb]} MB (#{swap[:used_pct]}%)" end if psi[:status] == :unknown puts "[UNKWN] PSI: #{psi[:note]}" else puts "[#{fmt.call(psi[:status])}] PSI memory pressure: some avg10=#{psi[:some_avg10]} avg60=#{psi[:some_avg60]} avg300=#{psi[:some_avg300]}" end if oom[:status] == :unknown puts "[UNKWN] OOM scan: #{oom[:note]}" elsif oom[:status] == :crit puts "[ CRIT] OOM scan (#{oom[:source]}): #{oom[:oom_events_found]} event(s) in last #{options[:oom_lookback_min]}m" oom[:sample].each { |l| puts " #{l}" } else puts "[ OK] OOM scan (#{oom[:source]}): no OOM-kill events in last #{options[:oom_lookback_min]}m" end puts puts "Overall: #{overall.to_s.upcase}"endexit exit_code
MemAvailable, not MemFree. /proc/meminfo is a plain Key: value kB text file. The script deliberately reads MemAvailable for the pressure calculation, not MemFree — MemAvailable already accounts for cache the kernel would reclaim under pressure, so it doesn’t cry wolf on a box that’s just using RAM the way RAM is supposed to be used.
PSI reacts faster than a used-memory percentage. /proc/pressure/memory reports the percent of the last 60 seconds any task spent stalled waiting on memory. That catches thrashing before it shows up as “low available memory” in the simpler check.
Everything degrades gracefully instead of crashing. No swap configured? Reported OK with a note, no divide-by-zero. PSI unavailable (older kernel, restrictive container)? Reported unknown, not a failure. Can’t read journalctl or dmesg (no root, no CAP_SYSLOG)? Same thing — unknown, and Open3.capture3 is used specifically so journalctl’s permission-hint noise on stderr doesn’t leak into the report.
Overrideable paths make it both container-friendly and testable. --meminfo-path and --psi-path exist so a monitoring container with the host’s /proc bind-mounted at /host/proc can point at the real data — and as a side effect, that’s exactly what made it possible to deterministically exercise the WARN/CRIT code paths in a sandbox with no swap and a perfectly healthy PSI reading.
mem-pressure-monitor: 2026-08-08 12:03:56 -0500[ OK] memory available: 3511 MB / 3915 MB (89.7% free, 10.3% used)[ OK] swap: not configured[ OK] PSI memory pressure: some avg10=0.0 avg60=0.0 avg300=0.0[UNKWN] OOM scan: neither journalctl nor dmesg were readable in this environment (needs root/CAP_SYSLOG)Overall: OK$ ruby mem_pressure_monitor.rb --meminfo-path meminfo_crit.txt --psi-path psi_crit.txtmem-pressure-monitor: 2026-08-08 12:03:56 -0500[ CRIT] memory available: 88 MB / 3906 MB (2.3% free, 97.7% used)[ CRIT] swap used: 1904 MB / 1953 MB (97.5%)[ CRIT] PSI memory pressure: some avg10=45.2 avg60=38.5 avg300=12.1[ CRIT] OOM scan (journalctl): 2 event(s) in last 60m Aug 08 11:58:02 web01 kernel: Out of memory: Killed process 4821 (ruby) total-vm:2048000kB Aug 08 11:58:02 web01 kernel: oom-kill:constraint=CONSTRAINT_NONE,nodemask=(null),cpuset=/,mems_allowed=0,global_oom,task_memcg=/user.sliceOverall: CRIT
Full script + README on GitHub: ruby-devops-toolkit/mem-pressure-monitor
- Ruby >= 2.7 (tested on 3.0.2)
- No gems —
optparse,json, andopen3are all Ruby standard library - Linux with
/proc/meminfo(universal) - PSI (
/proc/pressure/memory) needs Linux 4.20+ withCONFIG_PSI=y— degrades gracefully if missing journalctlordmesgreadable for OOM-kill scanning (root orCAP_SYSLOG) — also degrades gracefully
Running it
ruby mem_pressure_monitor.rb [options]
--mem-warn PCT/--mem-crit PCT— MemAvailable %% thresholds (default 15 / 5)--swap-warn PCT/--swap-crit PCT— swap-used %% thresholds (default 50 / 90)--psi-warn PCT/--psi-crit PCT— PSI “some avg60” %% thresholds (default 10 / 30)--meminfo-path PATH/--psi-path PATH— override for containers (e.g./host/proc) and testing--json— emit machine-readable JSON instead of text
# Plain snapshot
ruby mem_pressure_monitor.rb
# Tighter thresholds, JSON for alerting
ruby mem_pressure_monitor.rb --mem-warn 25 --mem-crit 10 --json
# Monitoring container with the host's /proc bind-mounted
ruby mem_pressure_monitor.rb --meminfo-path /host/proc/meminfo --psi-path /host/proc/pressure/memory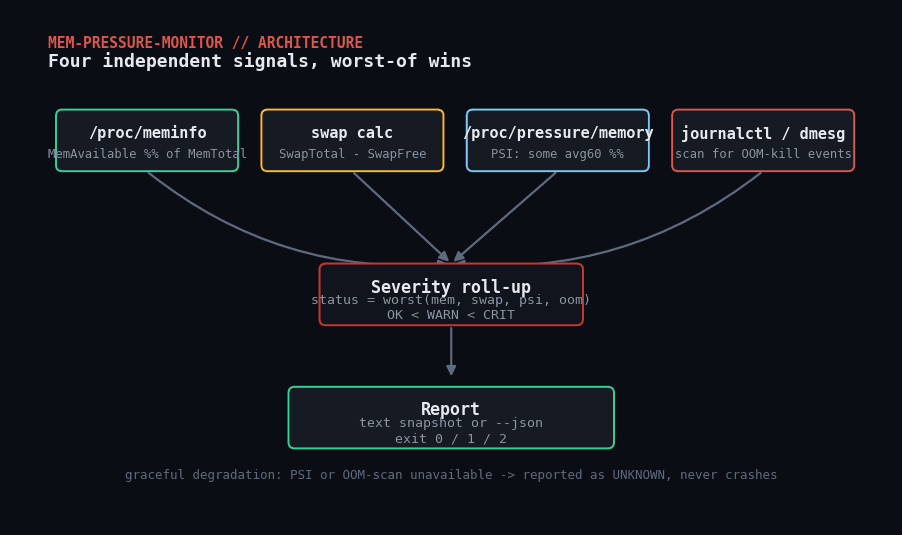
Full walkthrough
1. /proc/meminfo parsing
A regex parses every Key: value kB line into a hash. MemAvailable (not MemFree) drives the pressure calculation.
2. Swap analysis
SwapTotal - SwapFree gives bytes used. A box with no swap configured reports OK with a note instead of dividing by zero.
3. PSI parsing
/proc/pressure/memory has some/full lines with avg10/avg60/avg300/total fields. The script uses some avg60 as the primary signal.
4. OOM-kill scanning
Tries journalctl -k --since=-<N>min first, falls back to dmesg, and reports unknown (not a failure) if neither is readable. Output is scanned for Out of memory, oom-kill, and Killed process patterns.
5. Severity roll-up
Each of the four checks produces its own status; the overall result is the worst of the four, and the process exit code follows it (0 OK, 1 WARN, 2 CRIT).
Healthy box, then a simulated CRIT scenario
Troubleshooting
- OOM scan reports “neither journalctl nor dmesg were readable” — expected in most containers and for non-root users. Run with sudo, add
CAP_SYSLOG, or join thesystemd-journalgroup. - PSI reports “not available on this kernel/cgroup” — older kernels (<4.20) or
CONFIG_PSI=nbuilds don’t expose it; some container runtimes hide it too. The other three checks still work fine. - “swap: not configured” even though the host has swap — check you’re not pointed at a container’s
/proc; swap accounting is host-level, not namespace-level. - Thresholds trip right after a big batch job finishes — often real: a job that allocated a lot of memory and released it can leave
MemAvailablebriefly low until the kernel reclaims. If it’s routine, schedule around it rather than loosening--mem-crit.
Where to take this next
- Add a
--watch Nmode that re-checks every N seconds and only alerts on a state change - Feed the JSON output into a de-duplicated Slack/webhook alerter
- Track top memory-consuming processes via
/proc/*/statusalongside the OOM scan - Add cgroup v2
memory.pressure/memory.maxawareness for containerized workloads